
EFI - Enzyme Similarity Tool
EFI-EST and Cytoscape Tutorials
Dataset Analysis and providing a filtering score
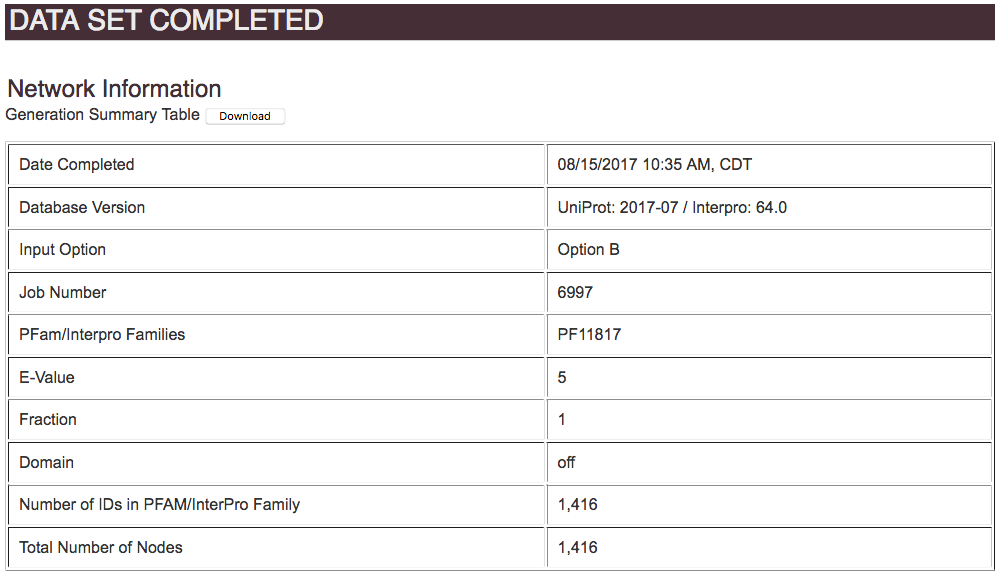
The information needed for the generation of the dataset has been fetched and processed. The similarity between the sequences retrieved has been calculated. Now the Dataset Analysis page provides a summary about the input used, and the returned calculations for the all-by-all BLAST. You must interpret the provided information in order to choose an alignment score that will be used for the final step of the SSN generation.
Choosing an appropriate threshold
Networks are best interpreted with an alignment score upper limit that gathers the sequences into clusters that represent families with only a single function (termed "isofunctional"). If the alignment score is too large, the network may be overly fractured, and isofunctional families will be split into multiple subfamilies. If the alignment score is too small, multiple families will be merged into a single cluster.
If a sufficient number of annotations is available, the optimum alignment score is determined empirically by mapping known functions onto the network (using functional annotations/node attributes included with network files and/or those that can be added by the user) and observing how they partition into separate clusters as the alignment score is decreased. This can be done by increasing the alignment score using Cytoscape's filter function. With this in mind, the recommended procedure is to output the initial SSN with a "low" alignment score so that isofunctional families are not separated. Although this alignment score will depend on the family, a useful "rule-of-thumb" is that isofunctional families often share >40% sequence identity. Thus, we recommend that the alignment score used to output the initial SSN should correspond to a lower sequence identity, e.g., 35%.
Information provided
The input method is summarized, for the user's records.
When the all-by-all BLAST is complete, EFI-EST provides four plots on the DATA SET COMPLETED page that are used to guide the selection of the alignment score for outputting the SSN:
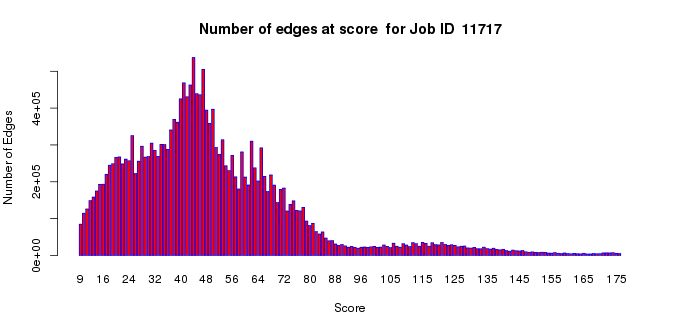
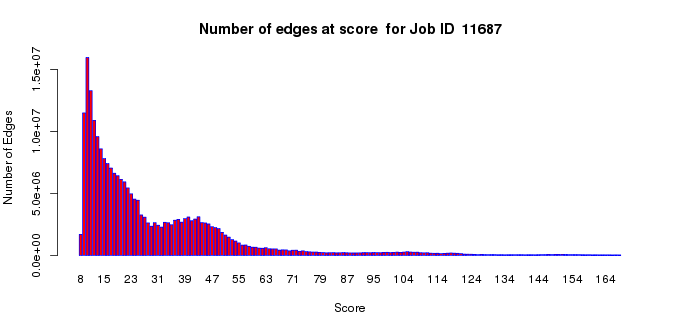
Number of Edges Histogram
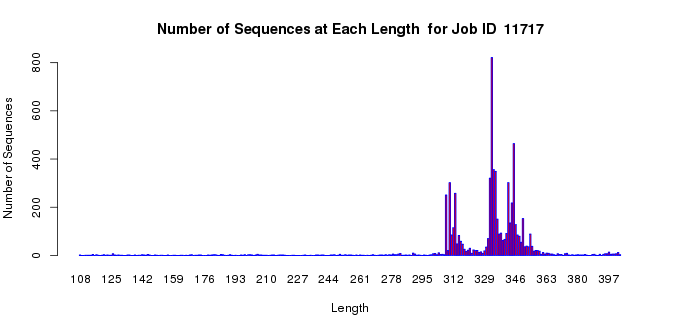
1 ) number of edges vs. alignment scoreLength Histogram
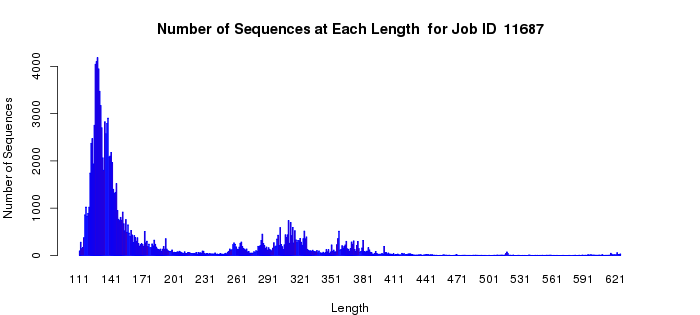
2 ) sequence length vs. occurrence- Quartile Plots*
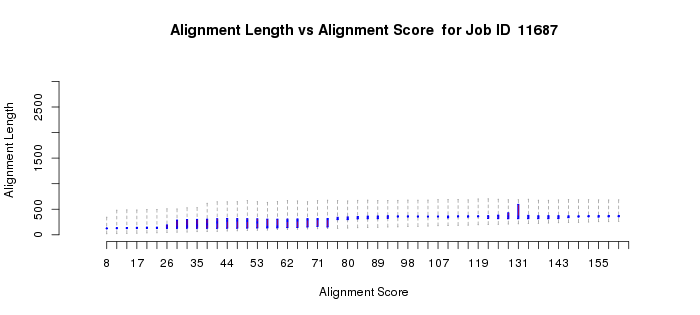
3 ) alignment length vs. alignment score
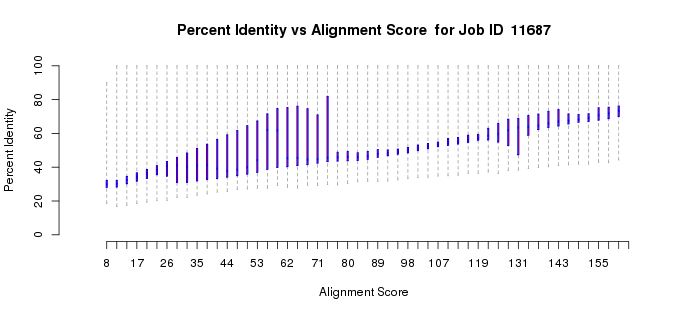
4 ) percent identity vs. alignment score
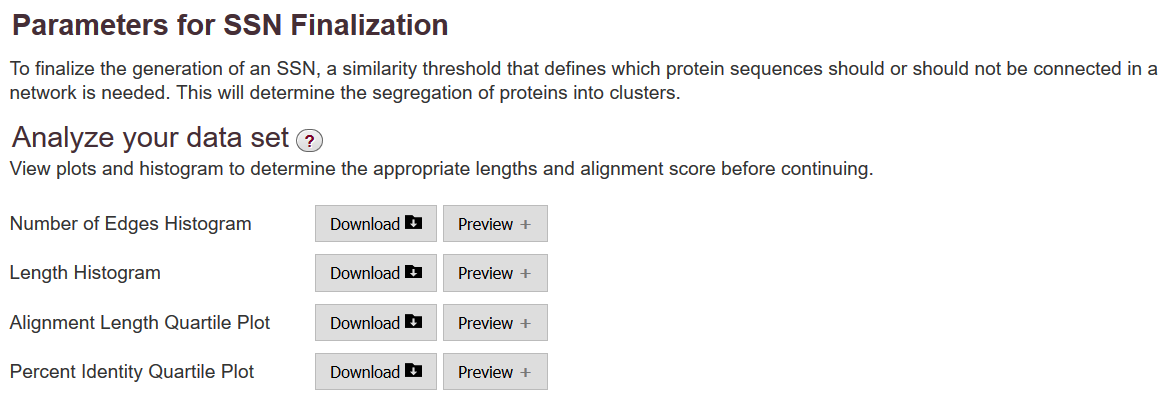
These can be viewed directly in your browser and/or downloaded to your computer.
The number of edges histogram allows an assessment of the number of edges as a function of alignment score in your dataset. The edges with large alignment scores (greater percent sequence identities) define isofunctional clusters; the edges with small alignment scores (lesser percent sequence identities) define the relationships between the isofunctional clusters. For functional assignment purposes, segregation of the SSN into isofunctional clusters is essential to distinguish among functions. For understanding the sequence/structural bases for divergent evolution of function, the connections between the isofunctional clusters are important. Thus, this plot may assist you with the selection of the alignment score threshold for generating your SSNs. In most cases, the small alignment scores will dominate this histogram (with the computation of these edges between isofunctional clusters dominating/lengthening the computation time for the all-by-all BLAST).
The length histogram allows an assessment of length heterogeneity in your dataset. Many proteins/enzymes contain a single functional domain; these will be the most straightforward for determining the alignment score to use for outputting the SSN (as described in the examples that follow). However, other proteins may have two or more domains as evidenced by the presence of longer sequences; these have the potential of complicating the selection of the alignment score for outputting the SSN (as also described in the examples that follow). Finally, because of sequencing errors, truncated fragments are commonly observed. Although the number of fragments in any dataset likely will be small, these have the potential to confuse the appearance/interpretation of the quartile plots.
The quartile plots and their use in guiding the selection of the alignment score are described in the two examples that follow.
Examples
Two examples are provided in the following sections: one for a family of single domain proteins, the second for a family that contains both single and multiple domain proteins.Example 1: a family of single domain proteins
For a "simple" case, the length histogram for the proline racemase superfamily (IPR008794), (Example 1B) shows that almost all of the proteins have roughly similar lengths within +/- 30 residues (a single domain).
The alignment length versus alignment score quartile plot (Example 1C) shows that as the alignment score increases, the length of the sequence that is included in the calculation of the alignment score increases to the full length of the proteins (~300 residues). For "small" alignment scores, when the alignment length is significantly less than the full length, both the alignment length and percent identity (Example 1D) plots show considerable "scatter" because short stretches of residues are responsible for the alignment score. The scatter is normal. [Some of the short alignment stretches may be caused by the presence of fragments that always are present as a result of sequencing errors.] In most cases, the small alignment score portions of both alignment length vs. alignment score and percent ID vs. alignment score quartile plots can and should be ignored.
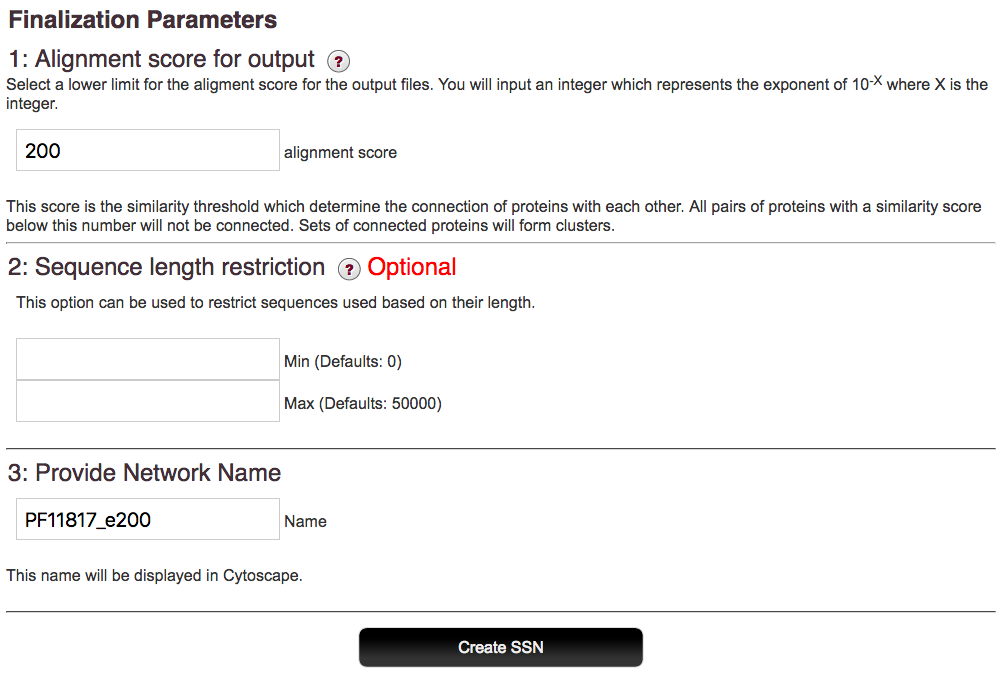
Instead, attention should be given to those portions of both plots when the alignment score calculation results from alignment of the full length of the sequence (in this case at alignment scores > ~20). For cases such as this, use the monotonic increase in percent identity as a function of increasing alignment scores to guide your initial selection of the alignment score to be used in generating the network file. Although there is no quantitative "rule" as to how function diverges as percent identity decreases, we recommend that your initial networks should be generated with an alignment score threshold that corresponds to ~35% sequence identity. Thus, in this example, an alignment score of 50 would be a good starting point for the initial networks and would entered into the field in part 2.
After you have the network, you can use the filter function in Cytoscape to remove edges that correspond to alignment scores larger than the initial value, thereby generating SSNs in which the nodes in clusters share greater percent identities. If sufficient functional annotation information is available for your family, the alignment score/percent identity that defines isofunctional clusters in your SSN can be determined empirically by decreasing the alignment score threshold until the assigned functions segregate into separate clusters.
In this case, there is no reason to filter on length, because the fraction of fragments is small, and the vast majority of the sequences contain a single domain. Thus, no values would be entered in the fields in part 3.
Example 1 (A). Number of edges histogram for the proline racemase superfamily (IPR008794).
Example 1 (B). Length histogram for the proline racemase superfamily (IPR008794).
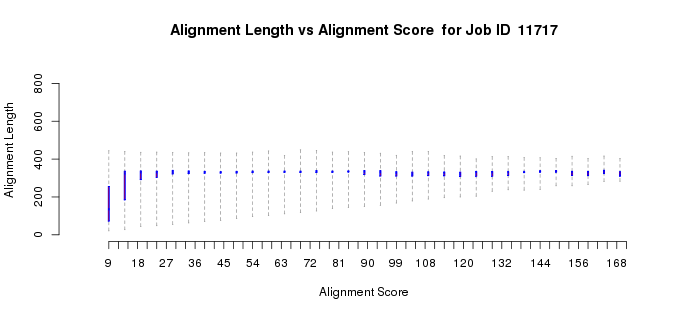
Example 1 (C). Alignment length vs. alignment score quartile plot for the proline racemase superfamily (IPR008794).
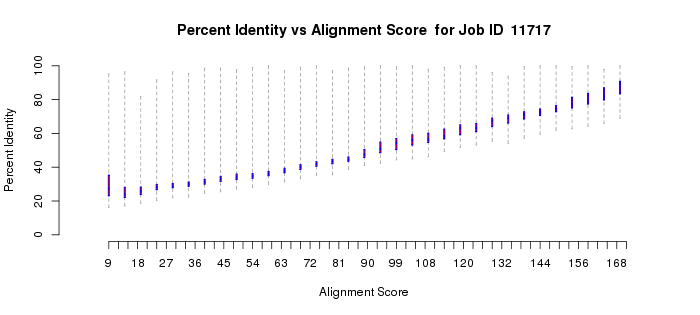
Example 1 (D). Percent identity vs. alignment score quartile plot for the proline racemase superfamily (IPR008794).
Example 2: multidomain proteins
In a more complicated situation, the polypeptides of homologous members of the vicinal oxygen chelate superfamily (VOC; IPR004360) can be either a single domain or two tandemly fused homologous copies of the same domain. The active sites are located at the interfaces between two domains, either from two one-domain polypeptides or at the interfaces of the two-domain polypeptides. In this case, the length histogram is bimodal (Example 2B). The quartile plots also reflect the bimodality: in the alignment length vs. alignment score plot, as the alignment score increases, the alignment length plateaus as the length approaches that of the length of the single-domain polypeptides; as the alignment score increases further, the alignment length increases and eventually plateaus at the length of the two-domain polypeptides (Example 2C). In the percent identity vs. alignment score quartile plot, the percent identity increases as the alignment score increases (Example 2D). However, when the alignment length increases to include the two-domain polypeptides, the percent identity decreases and then increases to again approach 100%. Notice that the interpretations of the quartile plots are inter-related: the "breaks" in the alignment length versus alignment score and percent identity versus alignment score plots occur at the same alignment score(s).
For multidomain proteins, our experience is that you should focus on the portions of the length and percent identity quartile plots at the smaller alignment scores that apply to alignment to the single domain and use that dependence of percent identity on alignment score to select the alignment score for generating your network. In this case, a value of 100 is an appropriate initial alignment score to enter in part 3.
Example 2 (A). Number of edges histogram for the VOC superfamily (IPR004360).
Example 2 (B). Length histogram for the VOC superfamily (IPR004360).
Example 2 (C). Alignment length vs. alignment score quartile plot for the VOC superfamily (IPR004360).
Example 2 (D). Percent identity vs. alignment score quartile plot for the VOC superfamily (IPR004360).
The field in part 4 is used to enter a title for your SSN. This title will be displayed in Cytoscape.
After the alignment score and length limits, if desired, are entered, EFI-EST generates the output network. As with dataset creation, this step may take awhile so you may close the running window in the meantime. When the network files are finished, you’ll receive an e-mail with a link to the file download page. This link will be active for 14 days so that you may return at your convenience.
*If you need a refresher on boxplots, there are several good online math resources (such as this page).
Click here to contact us for help, reporting issues, or suggestions.
University of Illinois at Urbana-Champaign
1206 W. Gregory Drive Urbana, IL 61801
efi@enzymefunction.org