
EFI - Enzyme Similarity Tool
EFI-EST and Cytoscape Tutorials
What is EFI-EST?
Prof. Patricia Babbitt’s group at UCSF first developed sequence similarity networks (SSNs) as a way to deal with the ever-increasing deluge of sequences deposited in public databases. Their seminal papers describing the SSN technique (1) and their program Pythoscape (2) were the inspiration for the EFI’s EFI-EST webserver.
EFI-EST is a web-tool that allows to easily generate SSNs that can be visualized in Cytoscape (3).
What is a Sequence Similarity Network?
A sequence similarity network (SSN) allows to visualize relationships among protein sequences. In SSNs, the most related proteins are grouped together in clusters.
Generating a SSN
The generation of a SSN involves two steps. First, a set of sequences to analyze is chosen, and an all-by-all BLAST is performed to determine, for each pair of sequences in the dataset, their similarity as a consideration of their relatedness. The second step involves filtering the sequences into clusters, based on a similarity threshold that is user defined.
Filtering sequences into clusters
When visualizing an SSN, protein sequences are represented as “nodes”. The line connecting two nodes is an “edge”. It is an indication of the relatedness between the nodes. An edge is drawn between nodes only if the BLAST pairwise similarity scores between the connected nodes is above a user defined threshold (Figure 1).
It is the user that defines the threshold at which sequences should be connected in a network. For families that contains non-isofunctional enzymes, a threshold score separating the different functions in different independent clusters is a good starting point. There is no predefined threshold: each protein set has its own optimal threshold that needs to be empirically determined.
Groups of highly similar proteins display a high degree of interconnectivity as the threshold alignment score is increased. These “clusters” are often very useful for the interrogation of enzyme function. Experienced users generate and compare several SSNs with various thresholds to visualize the interconnectivity evolution.
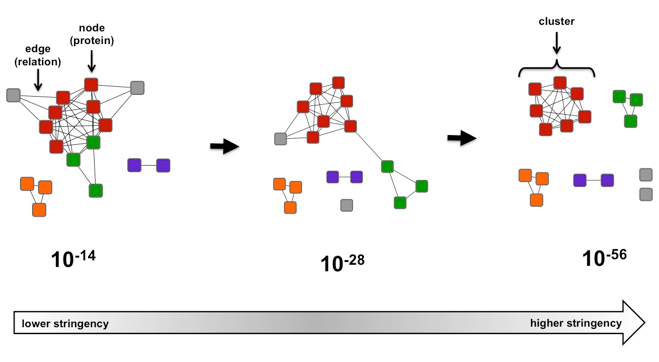
Figure 1. Example of a simple sequence similarity network as a function of e-value.
In the case of the Figure 1, if the alignment score threshold is specified as 28 (center), then edges are only drawn between nodes (protein sequences) that share that level of similarity (or greater). If two proteins are not connected, that means their sequences are less similar than described by the 28 threshold value. If the network is recalculated at a more stringent (greater) alignment score (right, threshold 56), the network is segregated into clusters of highly similar proteins. If the network is recalculated at a more permissive (lesser) alignment score (left, threshold 14), relationships between previously segregated proteins become apparent.
SSN VS phylogenetic trees
Although not as rigorous as traditional phylogenetic trees, SSNs typically display the same topology (Figure 2). However, the advantage of SSNs over trees is that large sequence sets (e.g. many thousands of proteins) can be analyzed much more quickly, and visualized easily using the network visualization Cytoscape (3).
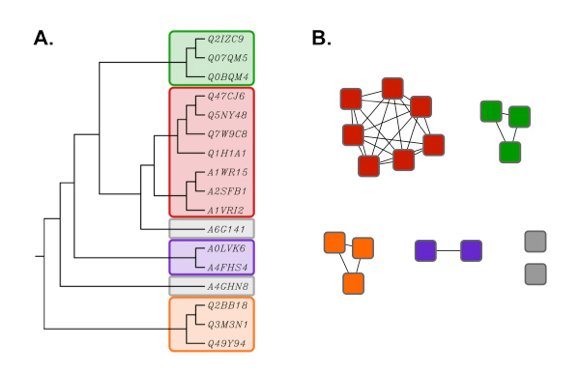
Figure 2. Rooted phylogenetic tree (UPGMA) created with ClustalW (A) using the same
sequence set as shown in the network in Figure 1 (B). Proteins in the tree are
identified by their six character UniProt accession numbers.
Node attributes in a SSN
Besides speed, another major advantage of SSNs is the ability to include pertinent information for each individual protein (such as species, annotation, length, PDB deposition, etc.). This information is included as “node attributes” which are searchable and sortable within a sequence similarity network displayed in Cytoscape (3).
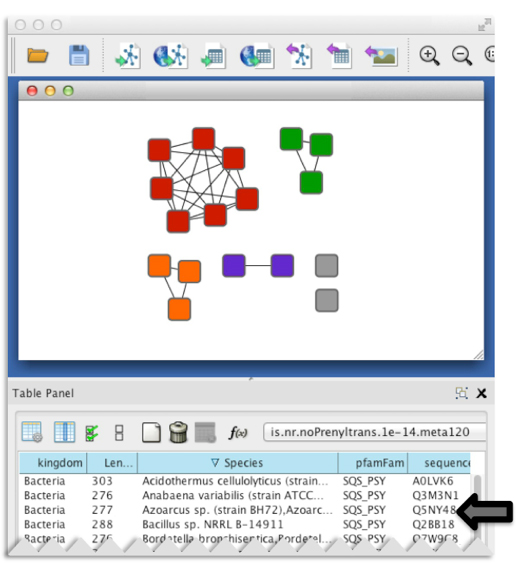
Figure 3. Representative node attributes for the example dataset as seen in a Cytoscape session.
Publication proven use of SSN
SSNs have been proven useful for examining the sequence relationships between proteins and have helped for functional assignment.
SSN typical usage:
-
To provide an overview of sequence-function relationships in a protein family
For example, examining the number of clusters found in a SSN as the alignment score increases allows an approximation of how many distinct families are found within the sequence set, especially when known functions are mapped onto the network. From this analysis, it may be apparent that distinct families have different functions or they have the same function but evolved from different ancestors to form discrete groups. In Figure 1, it appears that there are 6 possible families, 2 grey families (“singletons”) and an individual family for each of the remaining colors. This information is useful for understanding the diversity within a group of proteins and for identifying regions of sequence space for which little to no functional information is available, indicating an excellent area for the discovery of new functions. -
To view a particular sequence’s relation within a larger set of sequences
For example, if a cluster contains a protein of known function, it is possible that members of the entire cluster, including any unknown proteins of interest, share that function. This association is stronger if it remains intact at less stringent alignment scores. Likewise, if an unknown is found to be associated with a cluster of known function, but fractures at more stringent alignment scores (e.g. red and green nodes in Figure 1), it is possible that the unknown and known functions have a common partial reaction but differ in specificity. This scenario is common among functionally diverse superfamilies. In the simple network above, if the proteins in the red cluster were known to be isoprenoid synthases that catalyze elongation of shorter chain length products, then a plausible hypothesis could be that the proteins in the green cluster may catalyze elongation of medium or longer chain length products.
In either case, SSNs allow the user to quickly and easily view sequence relationships and gather information about proteins of known and unknown function. As sequence databases and needs to concatenate disparate information into a single visual aid grow, SSNs are increasingly more valuable for developing hypotheses.
Click here to contact us for help, reporting issues, or suggestions.
University of Illinois at Urbana-Champaign
1206 W. Gregory Drive Urbana, IL 61801
efi@enzymefunction.org