
EFI - Chemically-Guided Functional Profiling
Quantify Results
When the abundance quantitation is completed, EFI-CGFP sends an e-mail to the user. In the "Previous Jobs" tab, the job name will be changed to a link to the "Quantify Results" page.
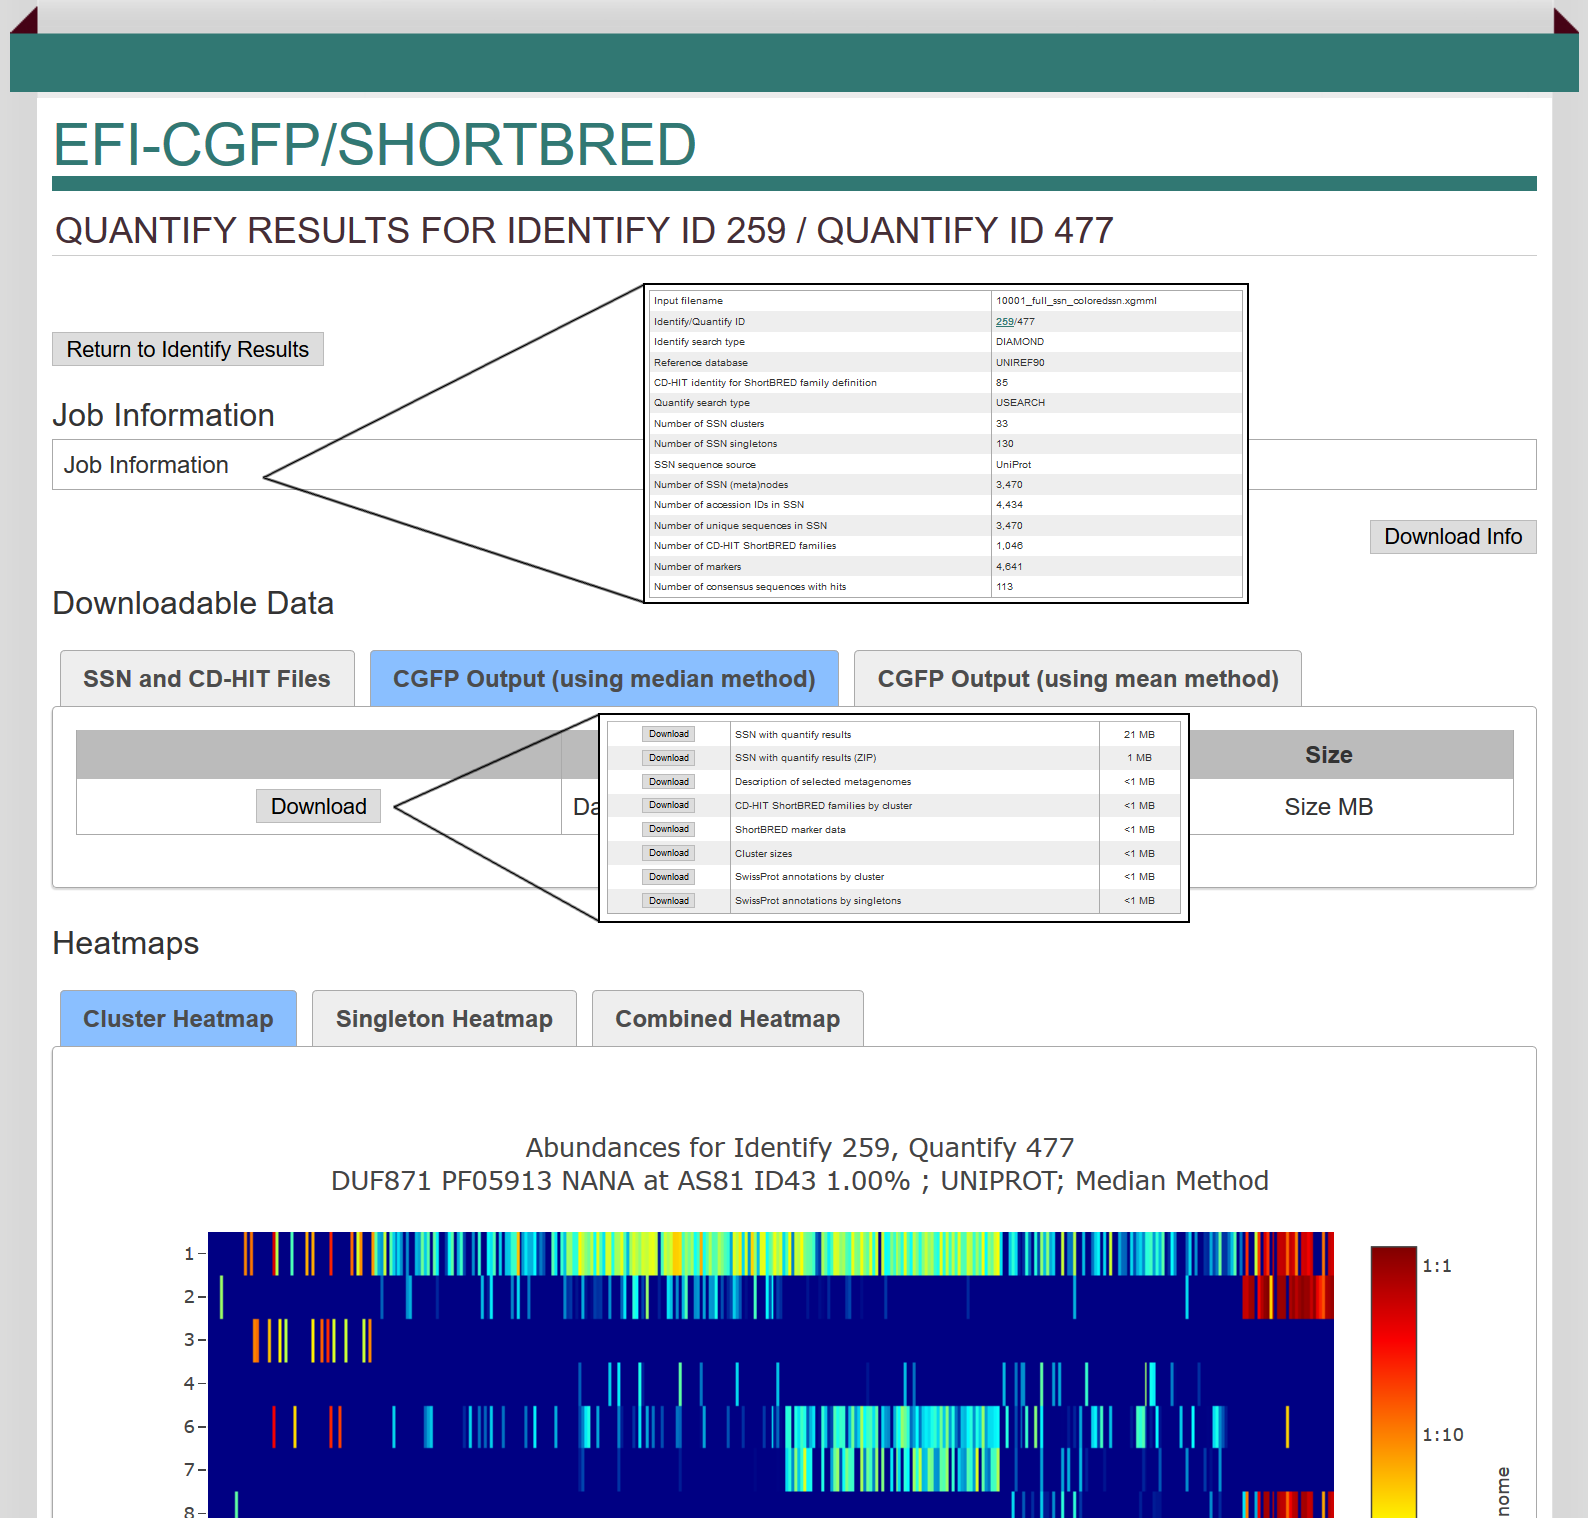
A table summarizing the Job Information is provided at the top of the page. The information is that provided on the "Markers Computation Results" page plus the number of consensus sequences with markers that identified metagenome hits. This information can be downloaded as a text file.
The next section provides three tabs to access files that can be downloaded:SSN and CDHIT files: Eight files can be downloaded, including:1) the SSN provided by the marker identification job to which a node attribute has been added for CD-HIT 85 seed sequence (meta)nodes ("Metagenomes Identified by Markers") that identified a match to its markers in one or more metagenome datasets ("SSN with quantify results"); 2) the zipped file for the same SSN; 3) a list/description of the metagenomes that were selected for abundance determination; 4) a tab-delimited text file that identifies the seed sequences for the CD-HIT ShortBRED families that were generated and the sequences that are contained in each cluster (CD-HIT ShortBRED families by cluster"; identical to the file provided on the Identify Results page); 5) a tab-delimited text file ("ShortBRED Marker data") that provides the identities of and information about the markers that were generated (identical to the file provided on the Identify Results page); 6) the number of sequences in the SSN clusters ("Cluster sizes", identical to the file provided on the Identify Results page); 7) the "SwissProt annotations by cluster" (and the accession ID for the SwissProt description; identical to the file provided on the Identify Results page); and 8) the "SwissProt annotations by singletons" (identical to the file provided on the Identify Results page).
CGFP Output (using median method): The default is for ShortBRED to report the abundance of metagenome hits for CD-HIT clusters using the "median method". The numbers of metagenome hits identified by all of the markers for a CD-HIT consensus sequence are arranged in increasing numerical order; the value for the median marker is used as the abundance. This method assumes that the distribution of hits across the markers for CD-HIT consensus sequence is uniform (expected if the metagenome sequencing is "deep", i.e., multiple coverage). For seed sequences with an even number of markers, the average of the two "middle" markers is used as the abundance. The files for download include: 1) a tab-delimited text file that provides raw protein abundance for all metagenome datasets; 2) a tab-delimited text file that provides raw cluster abundance for all metagenome datasets; 3) a tab-delimited text file that provides sum-normalized protein abundance for all metagenome datasets; 4) a tab-delimited text file that provides sum-normalized cluster abundance for all metagenome datasets; 5) a tab-delimited text file that provides average genome size (AGS) normalized protein abundance for all metagenome datasets; and 6) a tab-delimited text file that provides average genome size (AGS) normalized cluster abundance for all metagenome datasets. Sum-normalization converts the raw values in reads per kilobase of sequence per million sample reads (RPKM) to relative abundances (sum=1). Alternatively, AGS normalized outputs have been converted from raw RPKM to counts per microbial genome.
CGFP Output (using mean method): In the alternate mean method for reporting abundances, the average value the abundances identified by the markers for each CD-HIT consensus sequence marker is used to report abundance. This method reports the presence of "any" hit for a marker for a seed sequence. An asymmetric distribution of hits a seed sequence with multiple markers is expected for "false positives", so the mean method should be used with caution.
The files for download include: 1) a tab-delimited text file that provides raw protein abundance for all metagenome datasets; 2) a tab-delimited text file that provides raw cluster abundance for all metagenome datasets; 3) a tab-delimited text file that provides sum-normalized protein abundance for all metagenome datasets; 4) a tab-delimited text file that provides sum-normalized cluster abundance for all metagenome datasets; 5) a tab-delimited text file that provides average genome size (AGS) normalized protein abundance for all metagenome datasets; and 6) a tab-delimited text file that provides average genome size (AGS) normalized cluster abundance for all metagenome datasets. Sum-normalization converts the raw values in reads per kilobase of sequence per million sample reads (RPKM) to relative abundances (sum=1). Alternatively, AGS normalized outputs have been converted from raw RPKM to counts per microbial genome.
Heatmaps
The next section provides three tabs to access the heat maps:
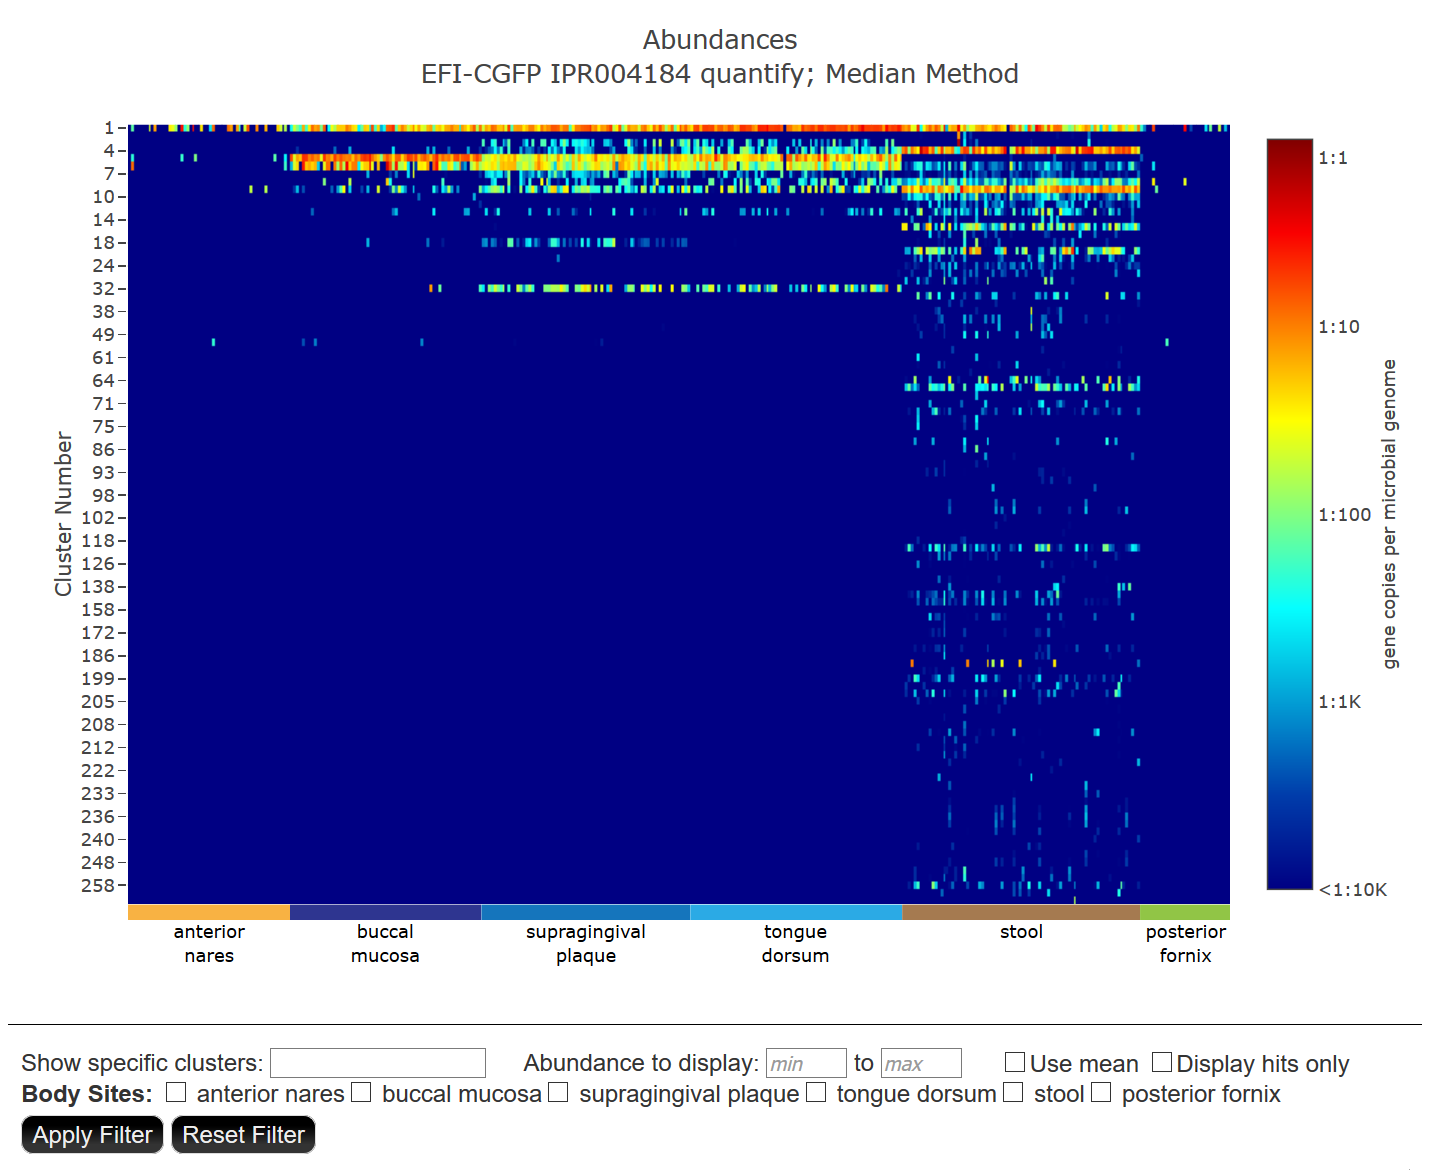
Cluster Heatmap: a heat map in which each SSN cluster/metagenome hit pair is colored according to average genome abundance. The metagenomes are grouped according to body site so that trends/consensus across the six body sites can be easily discerned. The default heat map is calculated using the median method to report abundances.
The y-axis lists the SSN cluster numbers for which metagenome hits were identified; the x-axis lists the metagenome datasets selected on the Identify Results page. A color scale is provided on the right that provides the AGS normalize abundance of the number of gene copies for the "hit" per microbial genome in the metagenome sample.
Two Filters for manipulating the heatmap are provided below the heat map: 1) "Show specific clusters" (individual cluster numbers separated by commas and/or a range of cluster numbers); 2) "Abundance to display" to specify minimum value andmaximum values for the abundance; and 3) "Maximum abundance to display" to specify a maximum value for the abundance.
Also, several check boxes are provided: 1) "Use mean" to display the heat map using the mean method for reporting abundances; and 2) "Display hits only" to display a black/white map showing presence/absence of "hits" (easier to see low abundance hits). Finally, check boxes are provided to display the heat map regions associated with specific body sites.
Map tools for download and manipulation the heat map can be accessed by hovering and clicking above and to the right of the heat.
Singleton Heatmap: a heat map in which each SSN singleton/metagenome hit pair is colored according to average genome abundance; the default heat map is calculated using the median method of report abundances.
The same display filters described for the Cluster Heatmap are available.
Combined Heatmap: a heat map in which each SSN cluster or singleton/metagenome hit pair is colored according to average genome abundance; the default heat map is calculated using the median method of report abundances.
The same display filters described for the Cluster Heatmap are available.
Finally, below the heat maps a list of the metagenomes that were used in the abundance quantification is provided.
A link is provided in the job information table at the top of the page that links to to the marker identification results.
Click here to contact us for help, reporting issues, or suggestions.
University of Illinois at Urbana-Champaign
1206 W. Gregory Drive Urbana, IL 61801
efi@enzymefunction.org