
EFI - Genome Neighborhood Tool
Example of Generating and Interpreting a GNN
This section provides an example of how EFI-GNT can be used to discover metabolic pathways.Although this example is "simple", it illustrates the strategy for using a GNN generated for an SSN cluster to identify functionally linked enzymes in pathways.
The EFI developed a strategy for discovering the in vitro activities and in vivo physiological functions (roles in metabolic pathways) of uncharacterized microbial enzymes (Biochemistry2015,54, 909-931). This strategy uses the solute binding proteins (SBPs; periplasmic in Gram-negative organisms and extracellular in Gram-positive organisms) of ABC and TRAP transport system to guide the discovery of the enzymes/pathway responsible for catabolism of the transported ligand. High-throughput/large-scale protein production and experimental ligand screening (using libraries of potential ligands) is used to identify the ligand for the SBP. Then, SSNs generated by the EFI-EST web tool and GNNs generated by the EFI-GNT are used to identify the pathway components as well as transcriptional regulators and other transport system components.
ABC transporters are the most abundant transport system, with multiple families of SBPs curated by Pfam. Some are curated as specific for carbohydrates, others for amino acids and peptides, and others for other small molecules/ions. These can be expected to provide a rich source of novel pathways for functional discovery and characterization.
The EFI’s strategy was initiated using the smaller TRAP transport system; it has a single Pfam-curated family of SBPs (PF03480). Many of the ligands for the TRAP transporters are anionic, carboxylates or phosphate esters, although exceptions have been discovered (vide infra).
Generating the input file for EFI-GNT: SSN for TRAP SBPs (PF03480)
The InterPro 58/UniProt 2016_06 database contained 19,503 sequences for TRAP SBPs (PF03480). Option B of EFI-EST was used to generate the SSN. When the SSN is filtered with an alignment score of 120 (~60% sequence identity), many of the clusters are "isofunctional" (Figure 1).
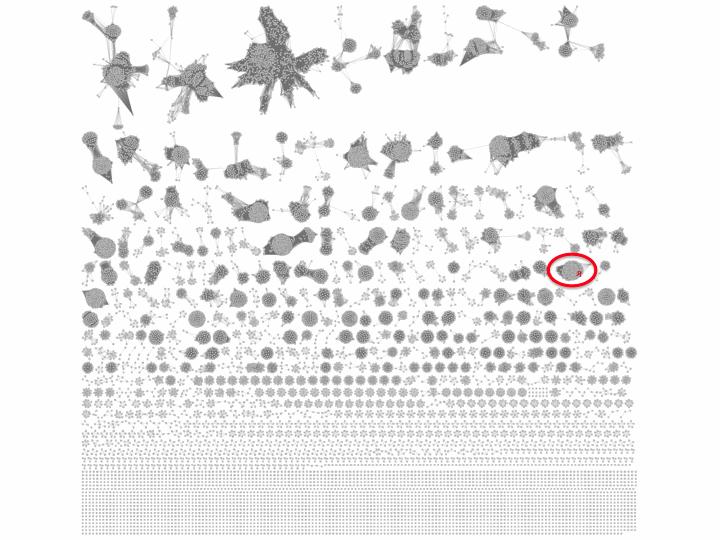
Figure 1. SSN for PF03480
Ethanolamine (EAL) was discovered as a ligand for a TRAP SBP from Chromohalobacter salexigens (UniProt ID Q1QZR9; Biochemistry 2015,54, 909- 931). Using the Select Control Panel and searching the name node attribute, Q1QZR9 can be located in a cluster in the SSN (red node in the circled cluster in Figure 1). All of the nodes in the cluster can be selected with the cursor and a daughter SSN containing only the family of EAL-binding SBPs can be generated (Figure 2) using the "New Network from Selection" tool at the top of the Cytoscape window.
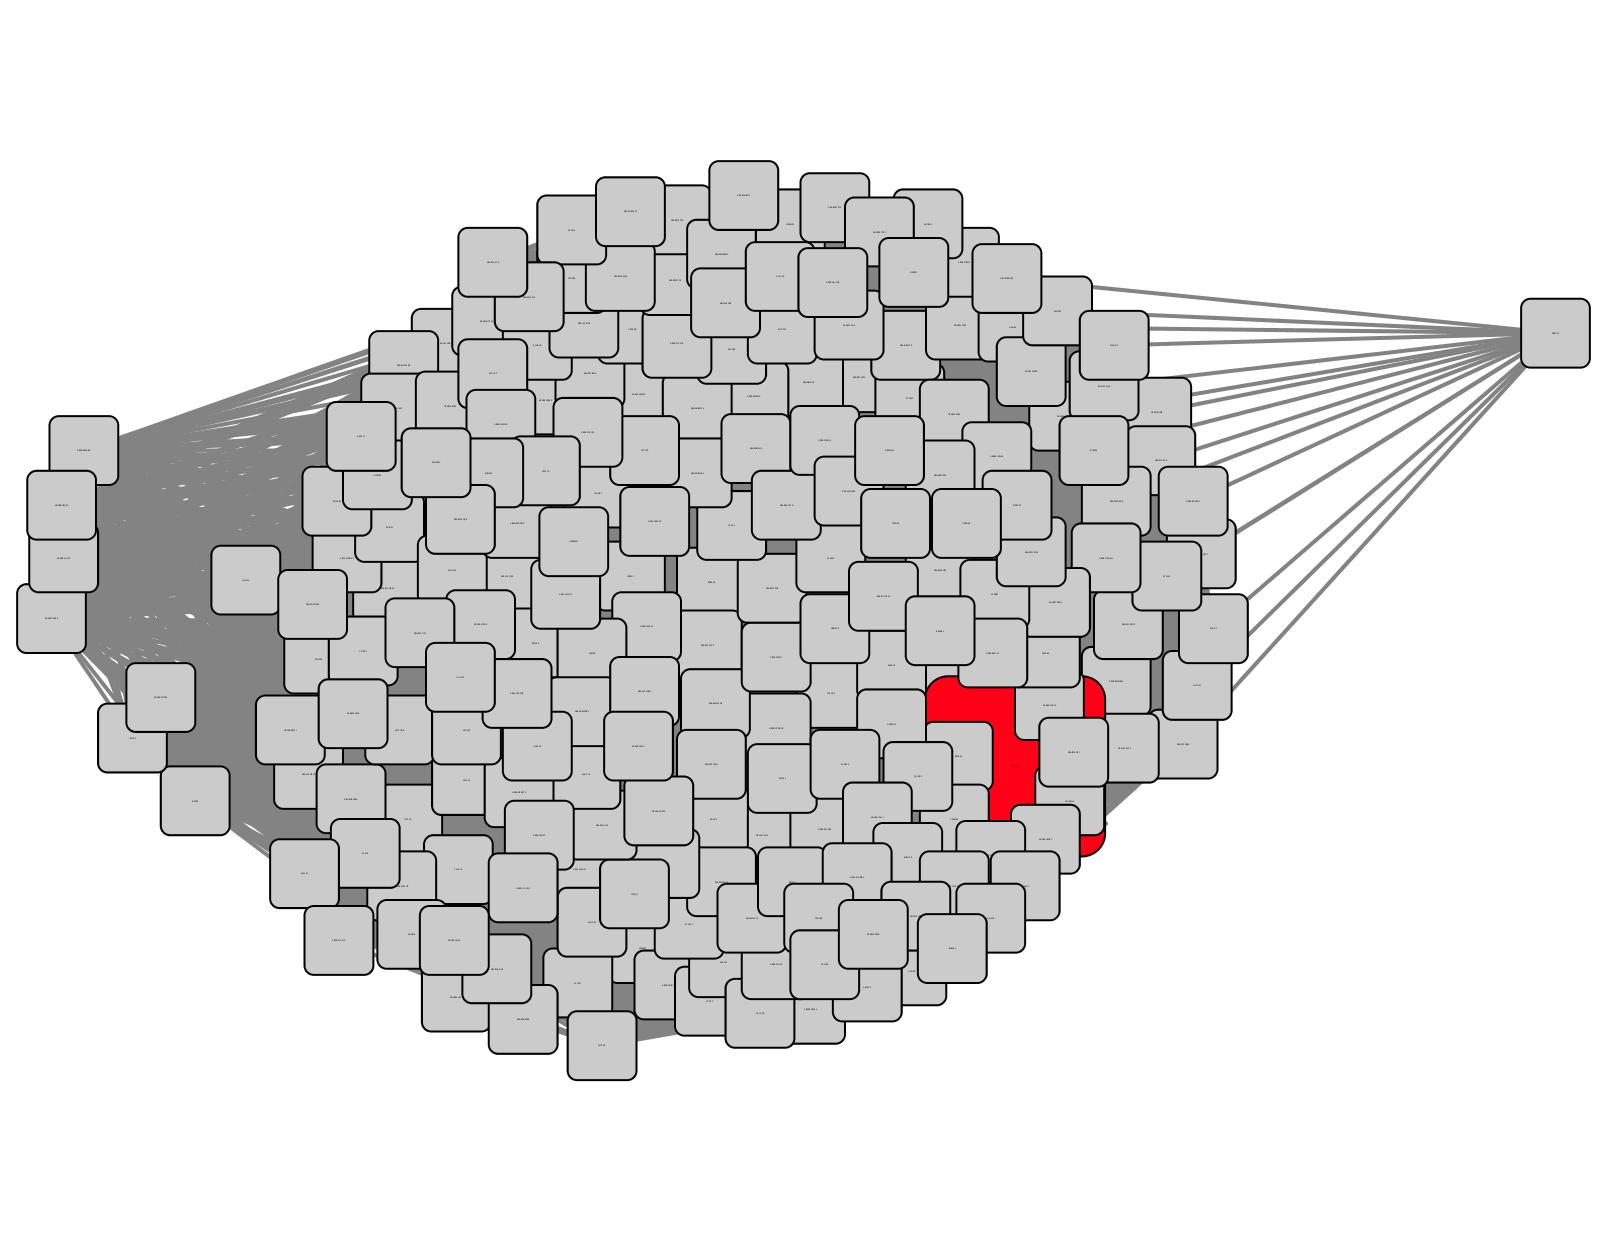
Figure 2. Daughter SSN for Q1QZR9 cluster
The .xgmml file for this cluster is the input for EFI-GNT; it is obtained as follows:
Under the File Menu, "Network" is selected in the "Export" submenu. In the "Export Network" window that opens, select XGMML (.xgmml, .xml) as the export file format. Then Save the Network by Browsing to locate the folder in which you would like to save the file, e.g., the folder that contains the Cytoscape session file for the SSN. This XGMML file is the input for EFI-GNT that will be used to identify the components of the catabolic pathway for EAL.
EFI-GNT Start Page: Uploading the XGMML File and Setting Parameters for Neighbor Collection
Input SSN: The Start page for EFI-GNT (button at the bottom of this page; http://efi.igb.illinois.edu//efi-gnt is used to upload the XGMML file for the EAL cluster. This file is selected using the Choose File function (Figure 3).
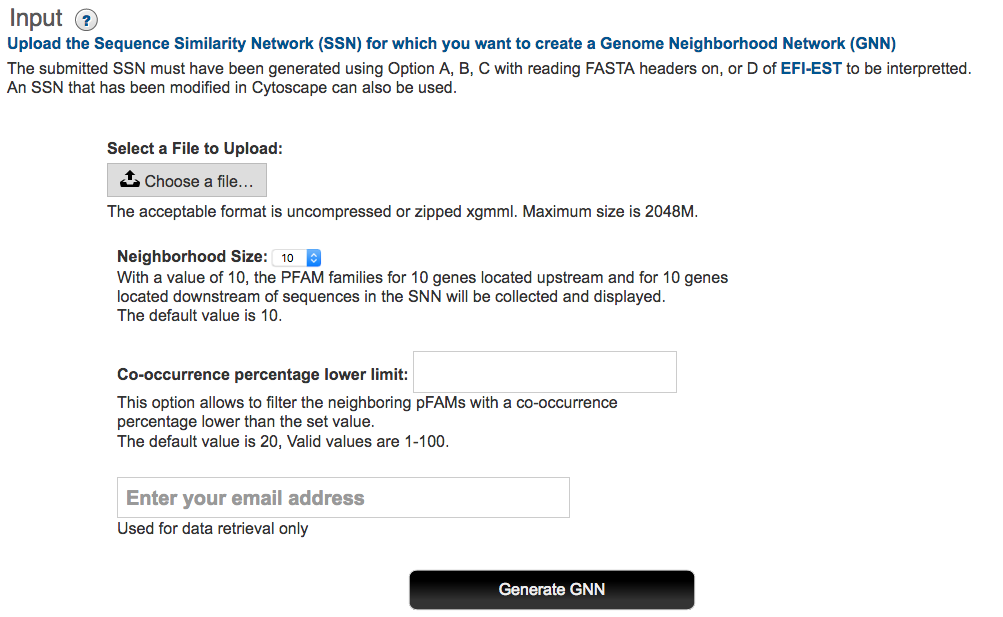
Figure 3. EFI-GNT Start/Upload Page
Genome neighborhood size: EFI-GNT uses a default window size of ±10 orfs to locate genome neighbors. As noted in a previous section, the signal to noise in the GNN increases as the window size decreases. If desired, the user can select a different window size from (±3 to ±20 orfs) on the menu on the Start page.
Co-occurrence frequency: EFI-GNT uses a default 20% lower limit for the co-occurrence frequency of SSN queries and their GNN neighbors to include members of a neighborhood Pfam family in the GNN. As the co-occurrence frequency increases, the signal to noise in the GNN should increase, i.e., functionally unlinked Pfam families present in the genome neighborhood occur with low co- occurrence frequencies if a diverse phylogenetic set of query sequences is present in the input SSN. For the beginning user, we recommend using the 20% default value.
Alternatively, the GNN can be generated with a small co-occurrence frequency, e.g., 5%, and filtered using the Select Control Panel at larger values of the Co-occurrence node attribute for the spoke-nodes. In the Pfam hub-node format GNN, this will identify the SSN query clusters associated with the selected co- occurrence frequencies; in the cluster hub-node format GNN, this will identify the Pfam families associated with the selected co-occurrence frequencies. The user then can select the directly connected hub-nodes in the Select/Node menu and generate the more stringent daughter GNN in a new network window (thereby preserving the original GNN).
[Alternatively, the user can filter the GNN using the Select Control Panel at range of values below the desired limit and delete the selected spoke-nodes. If a selected spoke-node is the only spoke-node in the cluster, the directly connected hub-node also should be selected for deletion. However, this will destroy the original GNN.]
Finally, the user enters his/her e-mail address; EFI-GNT sends an e-mail to this address when the GNN has been generated and is available for download.
Download Page: Colored SSN and GNN XGMML Files and Tab/Spreadsheet Files
As described in previous sections, EFI-GNT generates one SSN file and two GNN files.
The SSN isa colored version of the input SSN in which the nodes in each cluster are colored with the unique color.
The GNN is generated in two formats:
In the first GNN format, a cluster is present for each query SSN cluster (hub- node) that was used to identify genome neighbors (spoke-nodes).This format allows the user to identify functionally linked enzymes, as deduced from genome proximity, that constitute the metabolic pathway in which the sequences in the query SSN cluster participate.
In the second GNN format, a cluster is present for each Pfam family (hub-node) that was identified as a neighbor to queries in the SSN clusters (spoke- nodes).This format allows the user to assess whether queries in multiple SSN clusters are neighbors to members of the same Pfam family and, therefore, may have the same in vitro activities and in vivo metabolic functions.
The Download page contains links for each of these files; these are downloaded aszipped filesgiven their possible sizes (Figure 4).
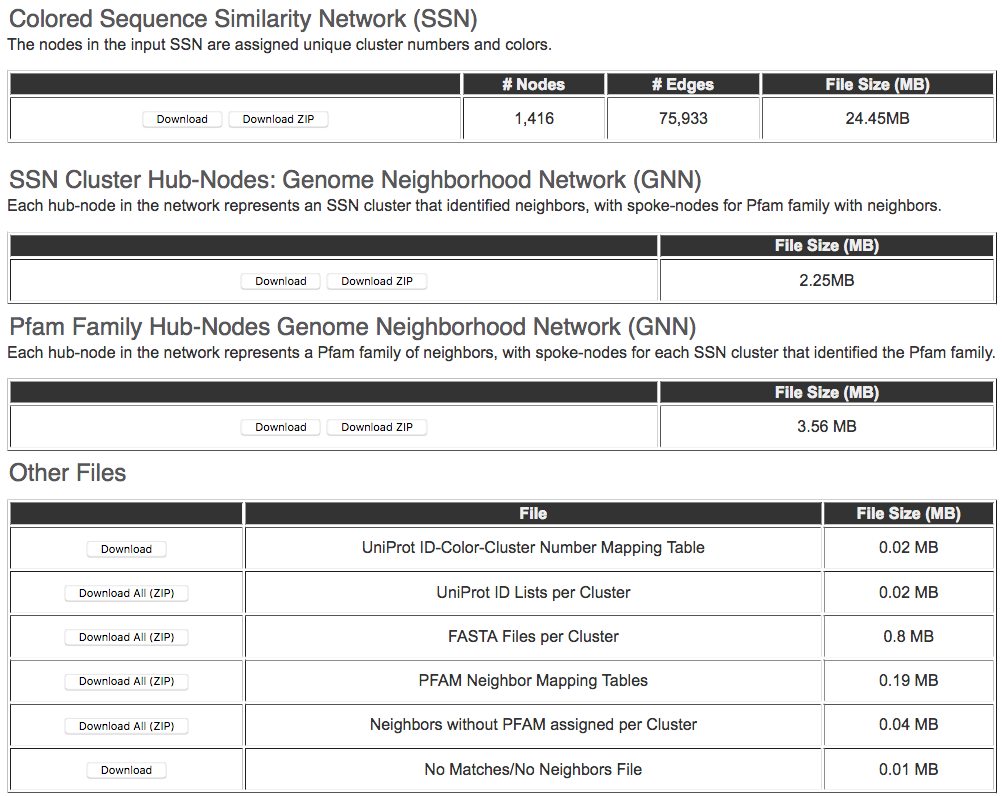
Figure 4. Output Page for Downloading Colored SSN, GNNs, and Tab/Spreadsheet Files
The Download Page also provides links for downloading
1. Text file containing all the UniProt IDs in the SSN, the color assigned to the ID, and the cluster number that the ID belongs to.
2. A compressed zip file containing files for each cluster that list the UniProt IDs.
3. A compressed zip file containing all of the FASTA sequences for each UniProt ID in the input SSN.
4. A compressed zip file containing all of the neighbors for each Pfam cluster in the GNNs.
5. A compressed zip file containing files for each cluster that list the neighbors of sequences in the input SSN that do not have Pfams assigned.
6. Text file with list of query accession IDs not found in the bacterial and fungal ENA files as well as those that do not have genome neighbors.
Colored SSN for EAL SBP Cluster
The colored SSN for the input EAL SBP SSN with the unique cluster colors and numbers is shown in Figure 5 (a single, uniformly colored cluster). It is identical to the input SSN (Figure 3b) except the nodes are uniformly colored. The input EAL SBP SSN did not contain any singletons—only a single multi-node cluster. If singletons are present in the input SSN, they are not used for neighbor identification; however, they are included in the GNN with the Cytoscape default color (cyan).
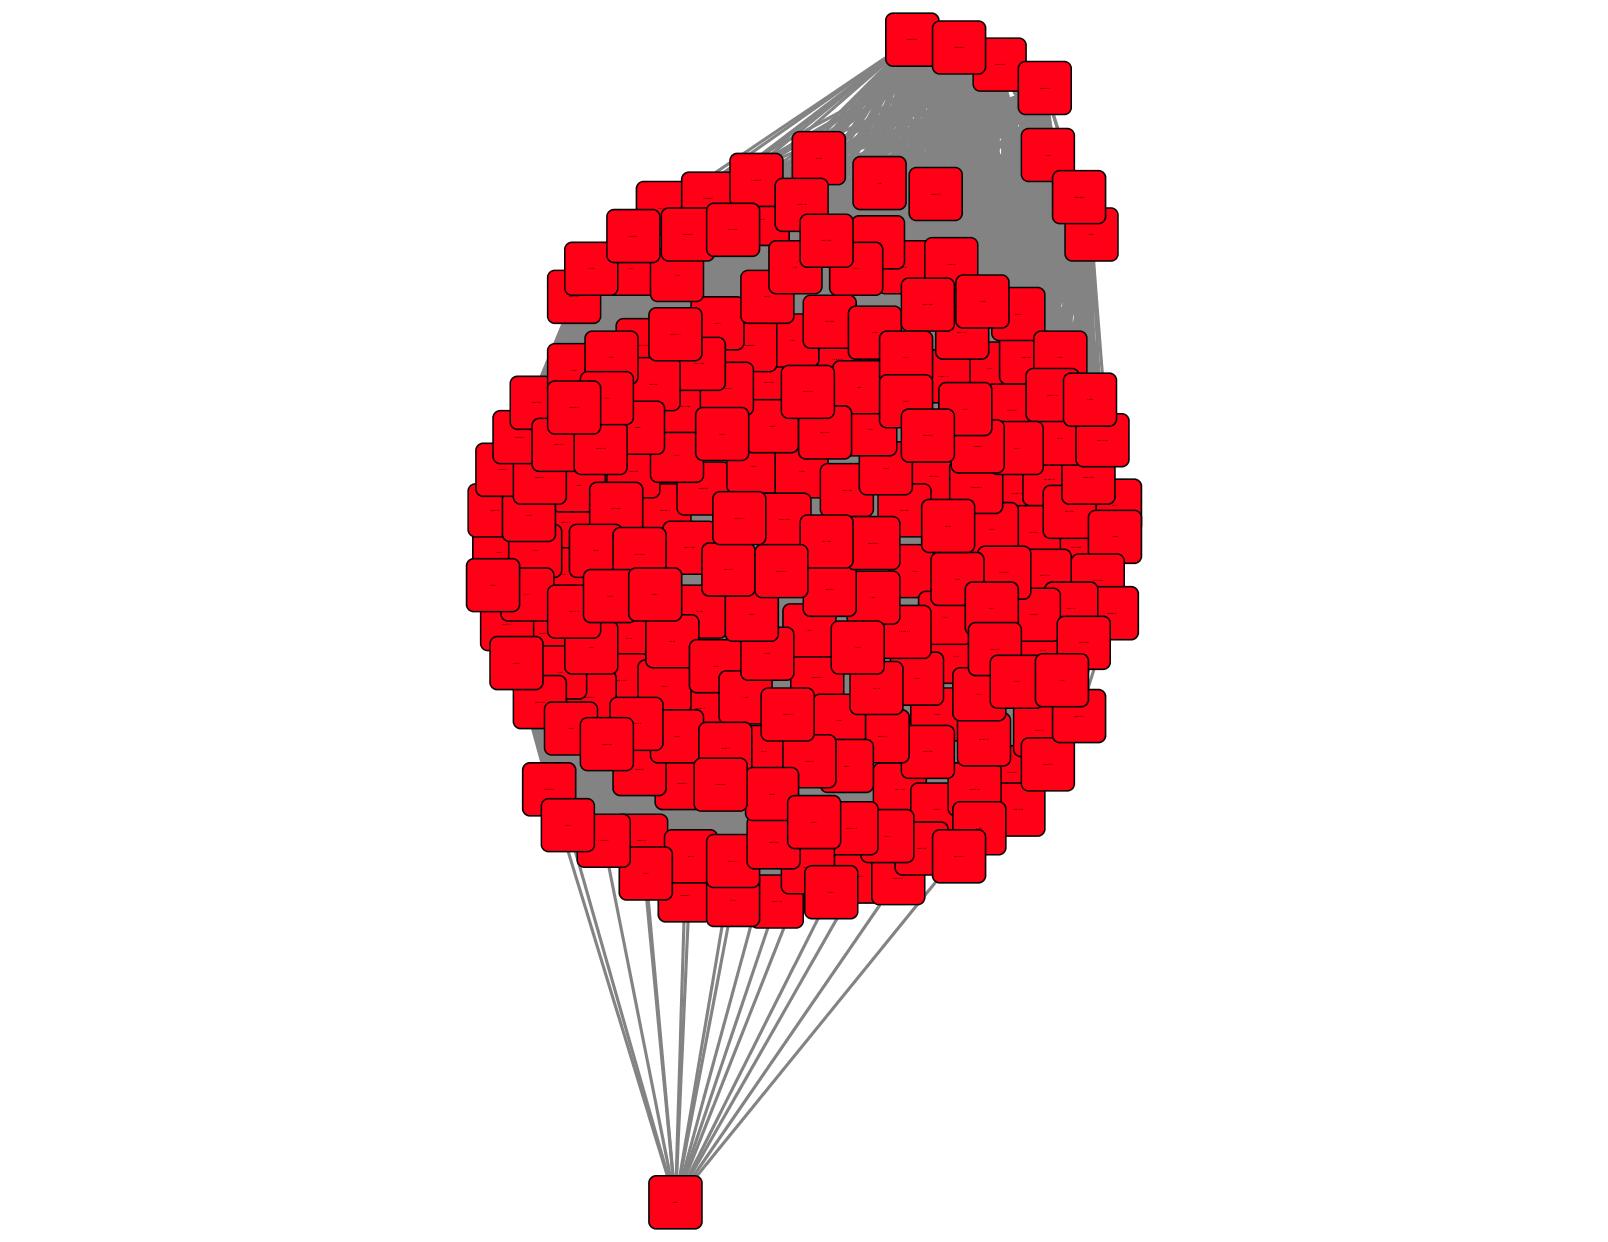
Figure 5. Colored SSN
Genome Neighborhood Network (GNN) for EAL SBP Cluster, Pfam family hub-nodes and SSN cluster spoke-nodes
The GNN with Pfam family hub-nodes and SSN cluster spoke-nodes is shown in Figure 6A. This GNN was generated with the default ±10 orf window and a 5% co-occurrence frequency; it has 31 clusters with hub-nodes for the Pfam families for genome neighbors. The cluster with the largest spoke-nodes contains information about neighbors not assigned to Pfam families--~20% of the proteins in UniProt are not assigned to a Pfam family.
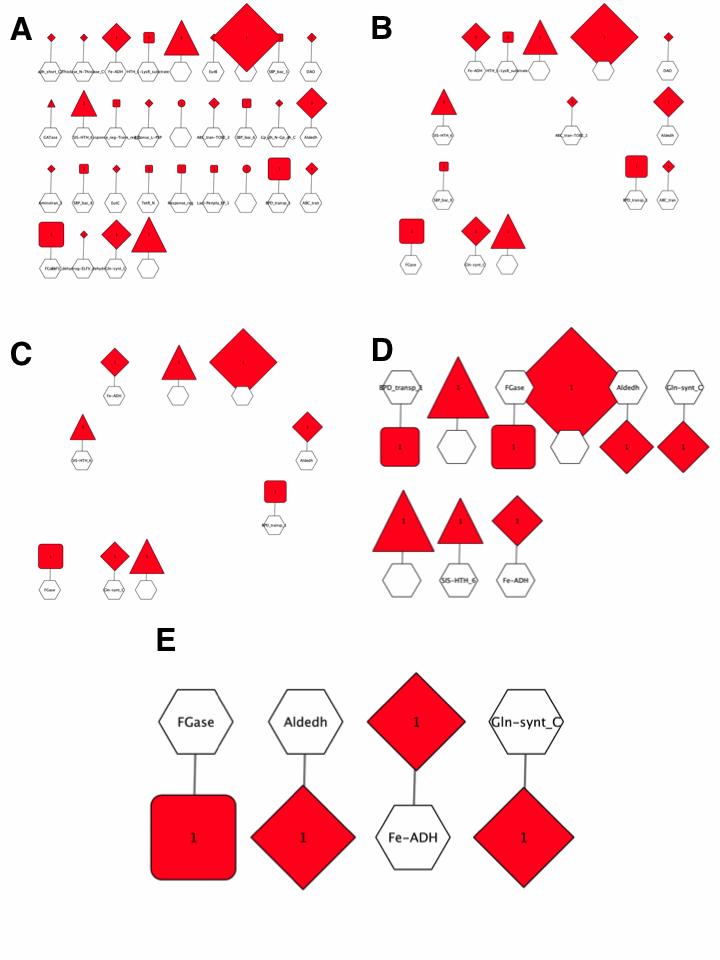
Figure 6. Pfam family hub-node GNN filtered with increasing co-occurrence frequency.
The 5% co-occurrence frequency GNN was filtered to identify the clusters associated with query-neighbor co-occurrence frequencies ≥ 10%; this GNN has 14 clusters with hub-nodes for the Pfam families for genome neighbors (Figure 6B).
The 10% co-occurrence frequency GNN was filtered to identify the clusters associated with query-neighbor co-occurrence frequencies ≥ 20%; this GNN has 9 clusters with hub-nodes for the Pfam families for genome neighbors as well as the two other components of the transport system (DctQ and DctM) and transcriptional regulators (Figure 6C/6D). Whereas the enzymes in pathways often, but not always, are conserved in pathways, the transcriptional regulators usually are not. Thus, multiple Pfam families may be present for different transcriptional regulators.
The clusters for the no Pfam cluster and the clusters associated with transport system components and transcriptional regulators were deleted from the 20% co- occurrence frequency GNN. The resulting GNN has 4 clusters with hub-nodes for the Pfam families for genome neighbors (Figure 6E):
1. Gln-synth_C, PF00120, glutamine synthase family
2. Fe-ADH, PF00465, Fe-dependent alcohol dehydrogenase family
3. Aldeh, PF00171, aldehyde dehydrogenase family
4. FGase, PF05013, formylglutamate hydrolase family
These Pfam families can be used to infer a catabolic pathway for EAL, the SBP ligand (Figure 7).
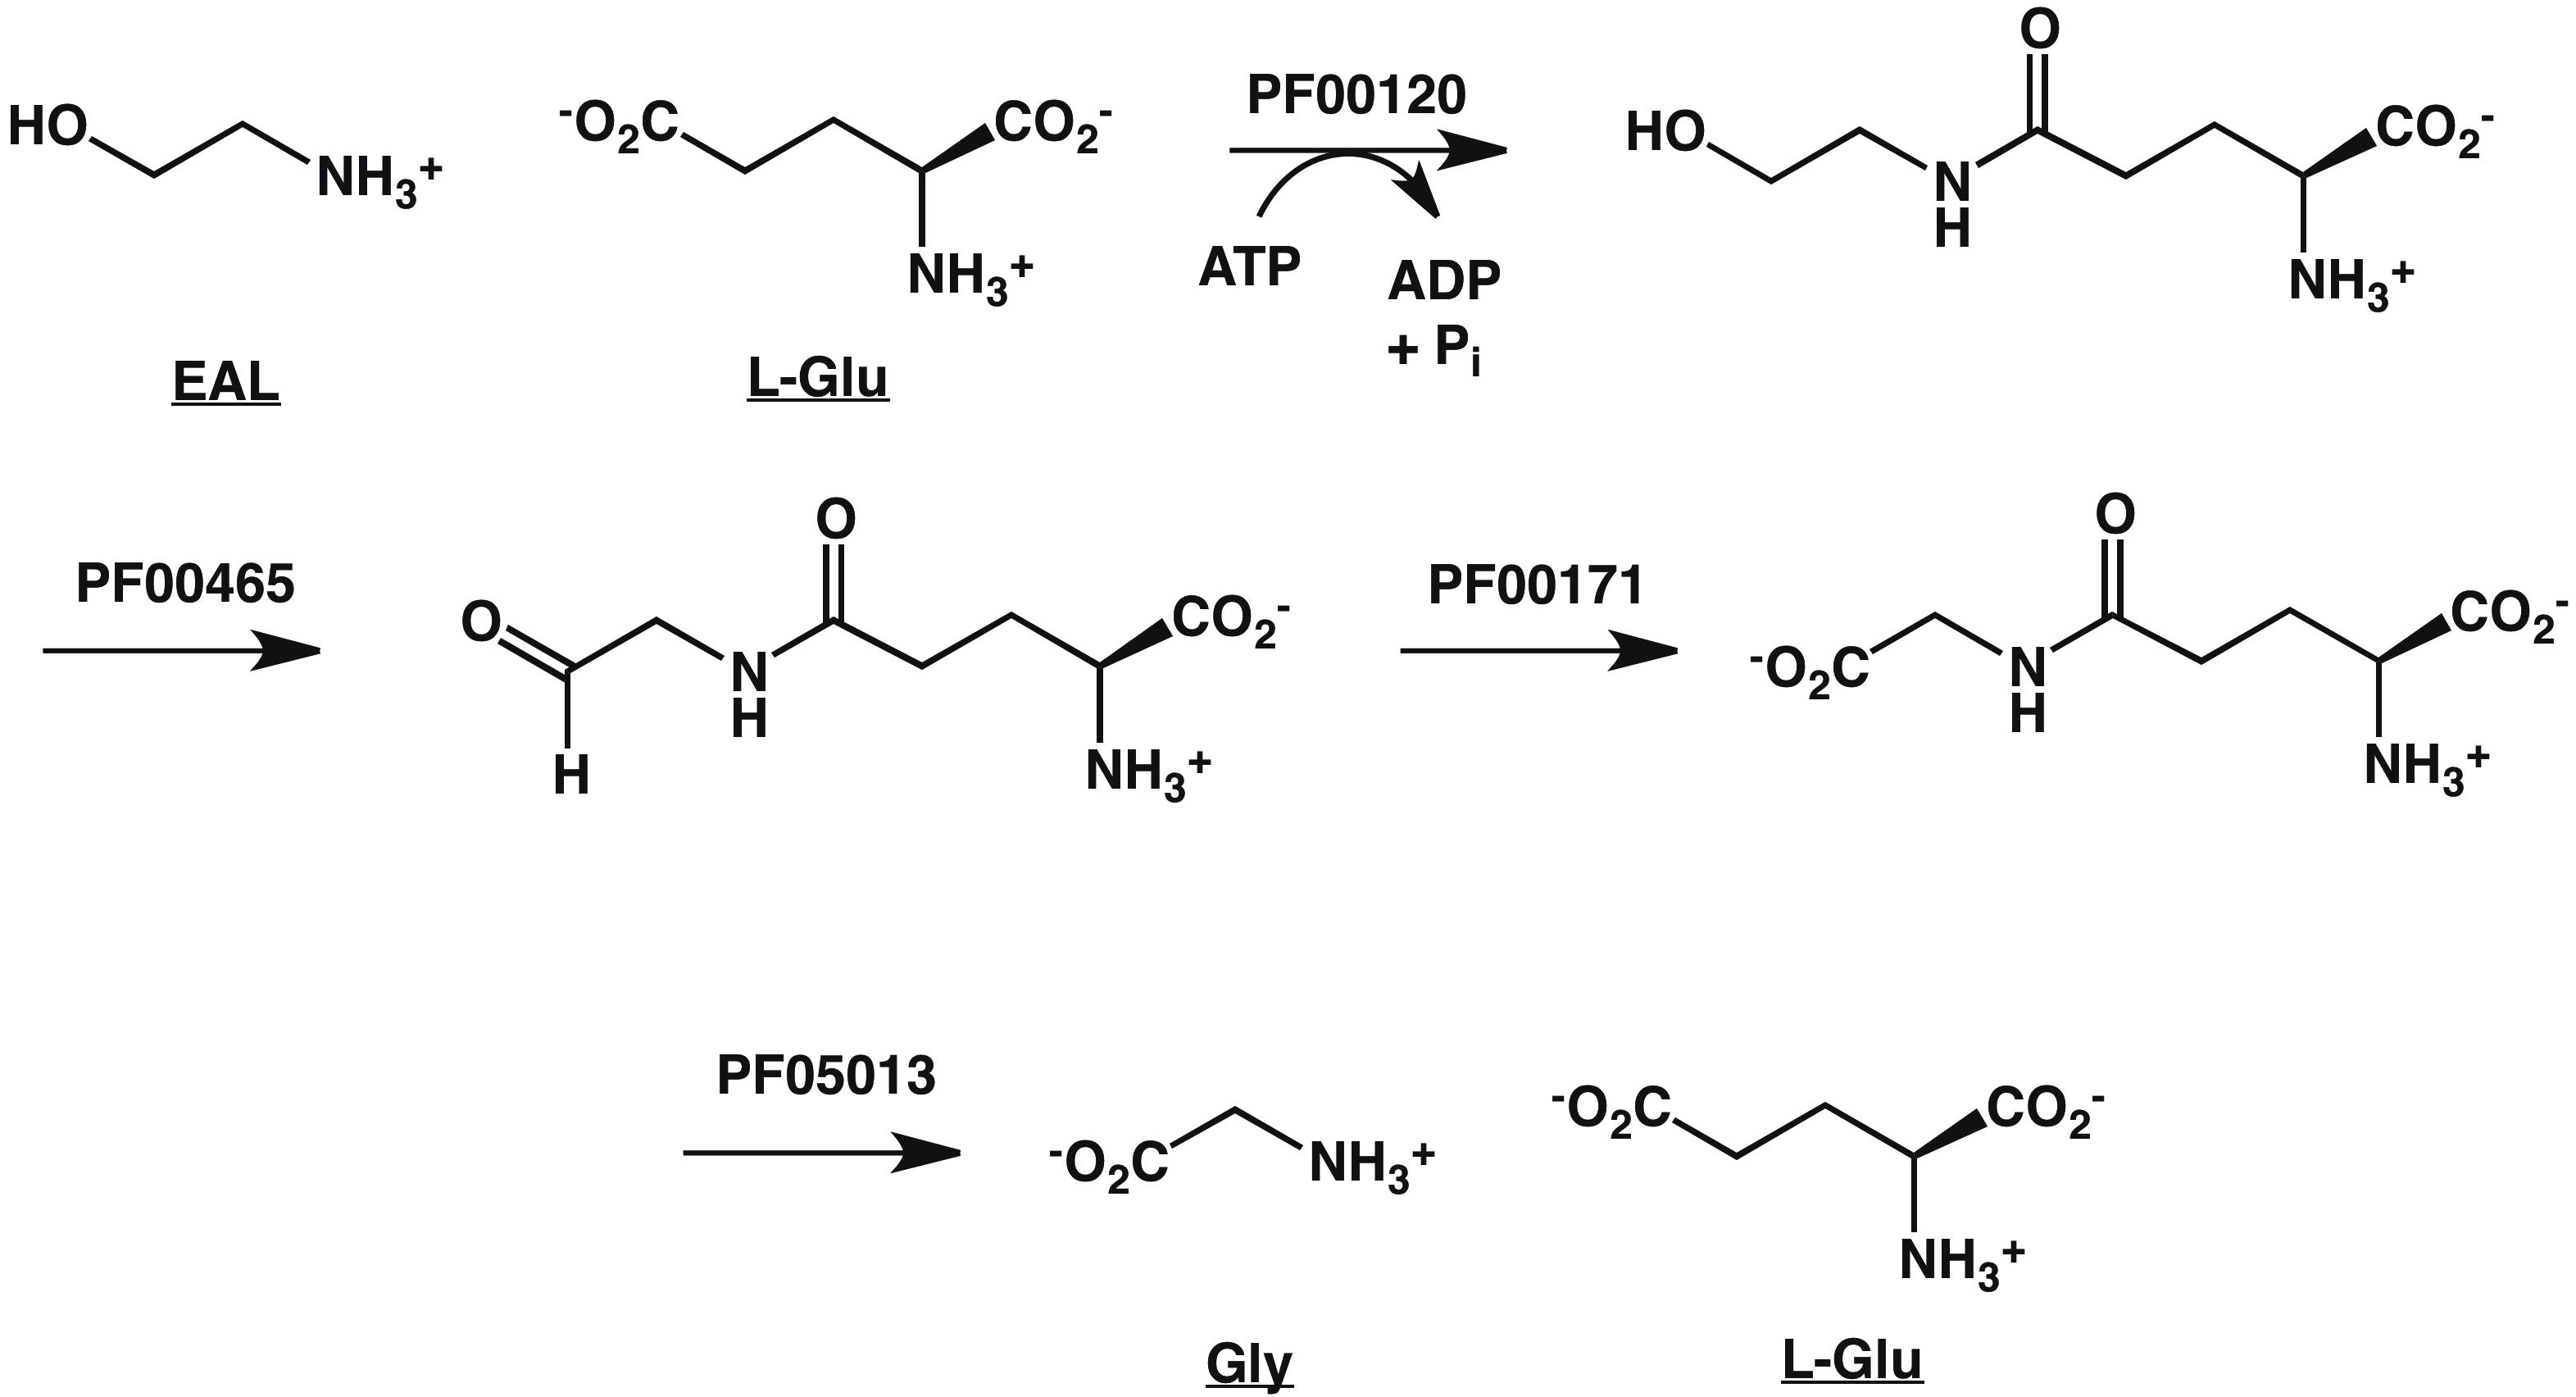
Figure 7. Pathway for EAL Catabolism Inferred from GNN
Genome Neighborhood Network (GNN) for EAL SBP Cluster, SSN cluster hub-nodes and Pfam family spoke-nodes
The complementary GNN with the EAL SBP SSN cluster hub-node and Pfam family spoke-nodes is shown in Figure 8A. This cluster has a single hub-node and 31 Pfam family spoke-nodes.
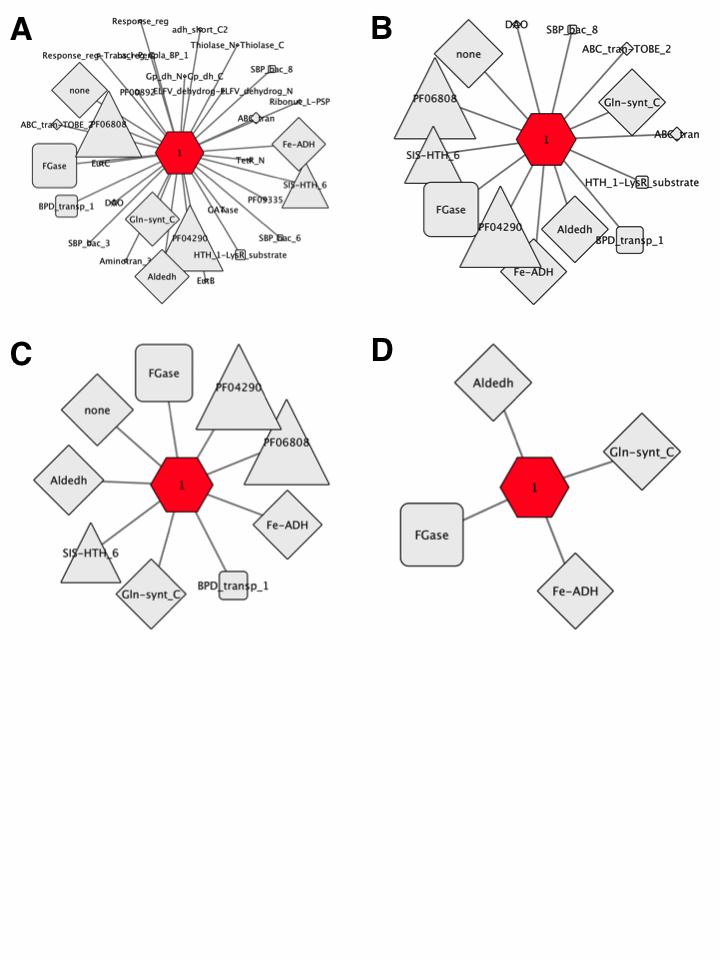
Figure 8. SSN cluster hub-node GNN filtered with increasing co-occurrence frequency.
The 5% co-occurrence frequency GNN was filtered to identify the Pfam spoke-nodes associated with co-occurrence frequencies ≥ 10%; this GNN has 14 spoke- nodes for the Pfam families for genome neighbors (Figure 8B).
The 10% co-occurrence frequency GNN was filtered to identify the clusters associated with co-occurrence frequencies ≥ 20%; this GNN has 9 spoke-nodes for the Pfam families for genome neighbors as well as the other components of the transport system and transcriptional regulators (Figure 8C).
The clusters for the no Pfam cluster and the clusters associated with transport system components and transcriptional regulators were deleted from the 20% co- occurrence frequency GNN. The resulting GNN has 4 spoke-nodes for the Pfam families for genome neighbors (Figure 8D):
- 1. Gln-synth_C, PF00120, glutamine synthase family
- 2. Fe-ADH, PF00465, Fe-dependent alcohol dehydrogenase family
- 3. Aldeh, PF00171, aldehyde dehydrogenase family
- 4. FGase, PF05013, formylglutamate hydrolase family
As described in the a previous section of the tutorial, the node attributes for the hub-nodes and spoke-nodes contain information about query-neighbor mean and median distances as well as the co-occurrence frequencies (decimal fraction and ratio of neighbors/queriable sequences).
Mapping genome neighbors to Pfam family SSNs
A spreadsheet file is available for download that will allow the genome neighbors in the various Pfam families to be mapped using the color of the cluster in the colored SSN to the SSNs for their Pfam families (#8 in the list of text/ spreadsheet files listed above).The columns in the spreadsheet can be added as custom node attributes to the SSN using the BridgeDB application in Cytoscape.
Figure 9 shows the mapping of the neighbors to the SSNs for PF00120 (Panel A; Gln-synth_C), PF00465 (Panel B; Fe-ADH), PF00171 (Panel C; Aldeh), and PF05013 (Panel D; FGase).
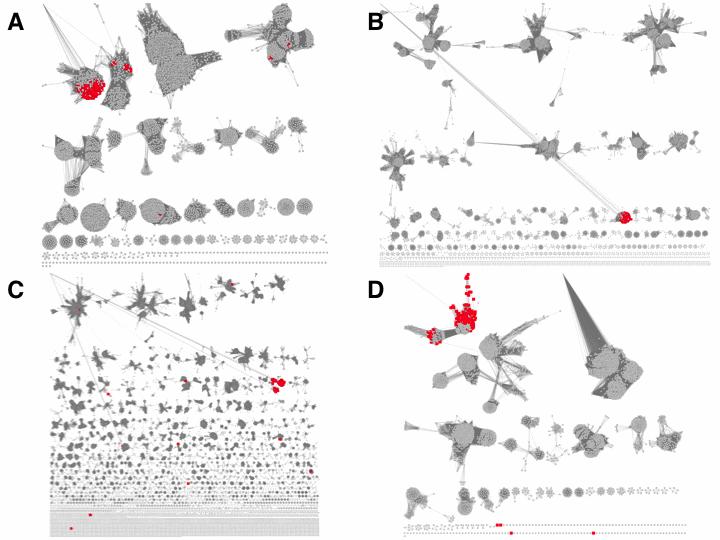
Figure 9. SSNs of genome neighborhood Pfam families. Panel A: PF00120; Gln- synth_C; alignment score 100. Panel B: PF00465; Fe-ADH; alignment score 100. Panel C: PF00171; Aldeh; alignment score 170. Panel D: PF05013; FGase; alignment score 65.
Notice that the mapping of the neighbors to these Pfam family SSNs facilitates selection of alignment scores to segregate the families into isofunctional clusters, i.e., multiple isofunctional sequences populate clusters in the SSN so that the user is more informed in decided an appropriate alignment score.
Also, not all nodes in the SSN clusters with neighbors of the EAL-binding SBP are colored—the enzymes in catabolic pathways are frequently conserved phylogenetically. However, the transport systems (and transcriptional regulators) often are not conserved, so the nodes in the SSNs that are adjacent to other transport systems would not be colored.
Multiple neighbors of the same large Pfam family in the genome neighborhood
Some enzyme Pfam families are large, e.g., PF00171, the aldehyde dehydrogenase superfamily has 138,202 sequences in UniProt 2016_06. As a result, a ±10 orf genome neighborhood may contain a functionally related member of the large family as well as one (or more) "random", functionally unrelated member(s). Using the SSN for PF00171 as an example, the neighbors identified by the EAL-binding SBP cluster were colored red in Figure 9C; the penultimate enzyme in the catabolic pathway for EAL is an aldehyde dehydrogenase from PF00171 that generates g-L-glutamyl-glycine from g-L-glutamyl-aminoacetaldehyde.
The spreadsheet used in the previous section for coloring the genome neighbors of the SSN queries also contains the absolute values of the query-neighbor distances. The Select Control Panel can be used to identify the nodes in the SSN that have user-specified values for the query-neighbor distance. In Figure 10, nodes in the SSN in Figure 9C that are ≥5 orfs from the queries are colored blue. All but two of the 12 remote sequences are second occurrences of PF00171 in the genome neighborhood of the EAL-binding SBP queries (determined by sorting the spreadsheet used to generate the custom node attributes). Thus, the query-neighbor distance information in the downloadable spreadsheet/custom node attribute can be used to identify functionally unrelated occurrences of multiple members of a neighbor Pfam family.
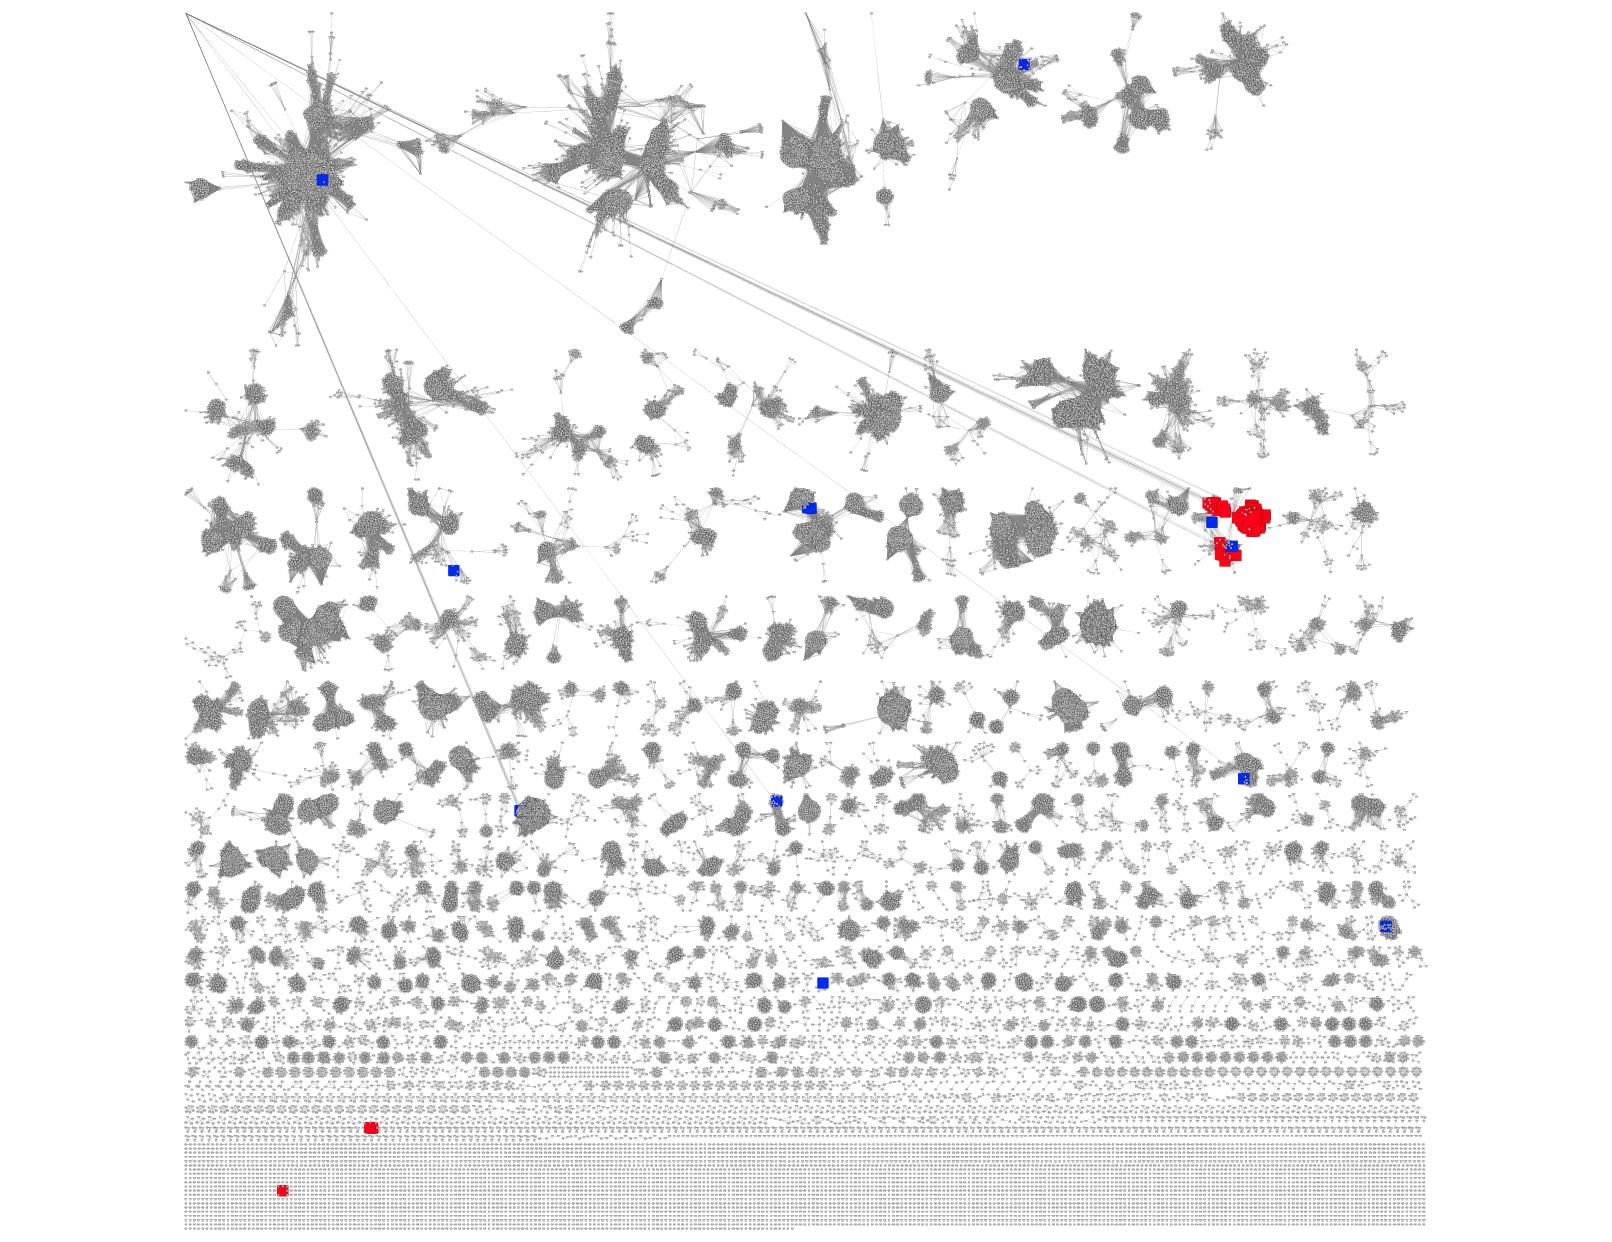
Figure 10. SSN for PF00171 (from Figure 9C) with the sequences associated with query-node distances ≥ 5 orfs colored blue.
Click here to contact us for help, reporting issues, or suggestions.
University of Illinois at Urbana-Champaign
1206 W. Gregory Drive Urbana, IL 61801
efi@enzymefunction.org