
EFI - Enzyme Similarity Tool
EFI-EST and Cytoscape Tutorials
An Introduction to Using Cytoscape for EFI Networks
The following tutorial has been modified from the Cytoscape Wiki to specifically address working with networks created by the Enzyme Function Initative (EFI). To view Cytoscape 3's extensive tutorial pages, please go here.
Contents of this Tutorial
- Download Cytoscape
- Initial Steps
- Selecting Nodes
- Node Attributes Data Panel
- Searching
- Changing Visual Styles
- Filtering a Network
- Saving Sessions
- Opening a Session File
1. Download Cytoscape
Go to http://www.cytoscape.org/download.html and download a copy of Cytoscape. Check that your machine is running an up-to-date and correct (32-bit or 64-bit to match your Windows OS) version of Java Runtime Environment, to ensure successful installation of Cytoscape.
2. Initial steps
Before starting, you will need a dataset in the form of an xgmml file. Here is an example file for you to begin with if you do not have one already. Launch Cytoscape. You should see a window that looks like this:
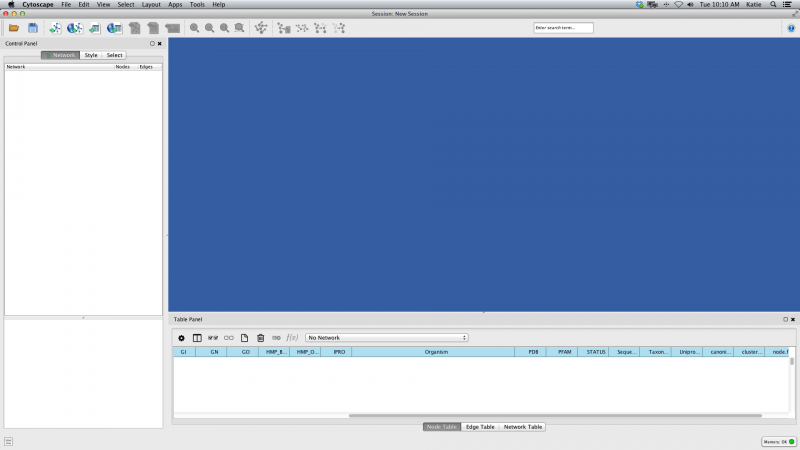
Figure 1. Cytoscape Start Screen
Load your network file into Cytoscape by selecting File → Import → Network → File... and navigating to the location of your .xgmml file. Once loaded, click OK on the Import Network popup window. The example file consists of 497 edges observed between 60 proteins, which you can see in the left-hand pane.
Now your screen should look like this:
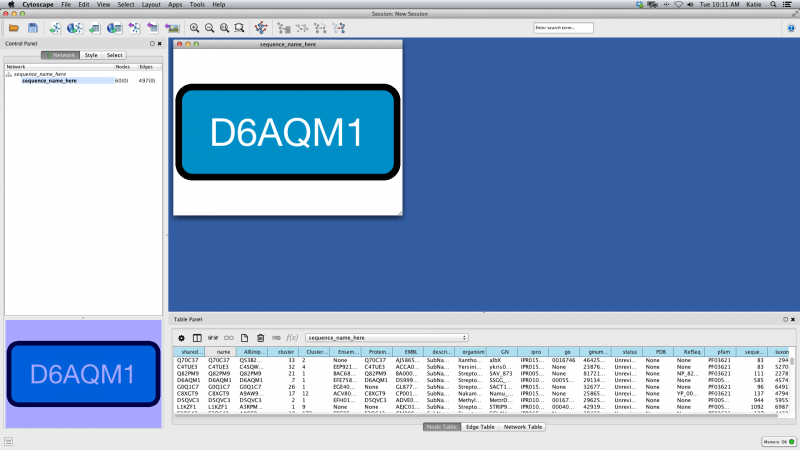
Figure 2. Network Load Unformatted Example
The initial view is not informative, but this is normal. Under the Layout menu, select yFiles Layouts → Organic. After a brief calculation, your screen should look like this:
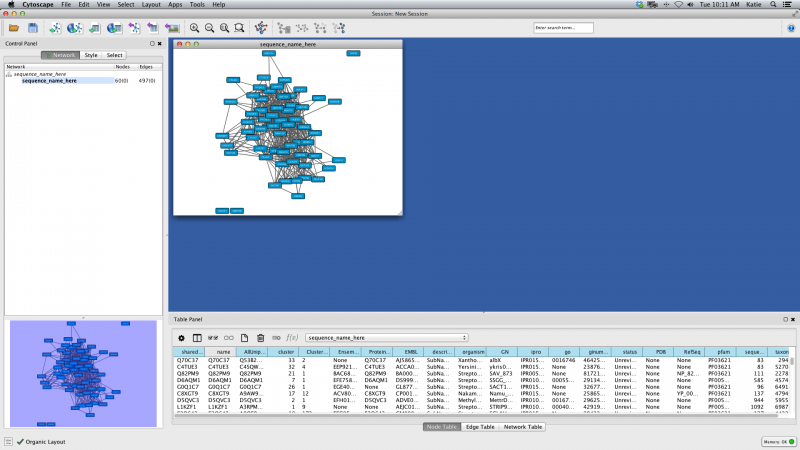
Figure 3. Organic Layout Example
3. Selecting nodes
On the Cytoscape canvas (the blue window showing the network graphic), you can select single nodes by clicking with the mouse or multiple nodes by holding shift and clicking. You may also click and hold in the white space to drag out a rectangle which will select multiple nodes within a given area. Notice that if you right click (control+click on Mac) on any node, you will get a sub-menu to carry out node-specific actions or access external links, such as External Links → Sequences and Proteins → UniProt.
4. Node Attributes Data Panel
Notice that at the very bottom of this window is the Data Panel. It looks like this:
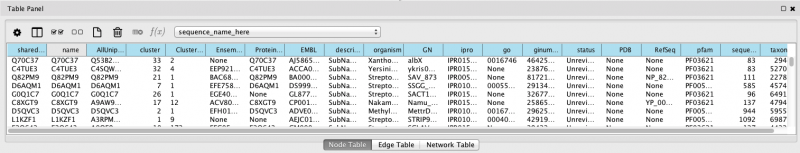
Figure 4. Node Table Panel Example
Select a few nodes and you will see protein-specific information ("Node Attributes") appear in the data table. You can use the icons on the upper left to choose which attributes to display. As shortcuts, the third icon and the fourth icon will display all or none of the attributes, respectively. Double click (single click on Windows) the top of any column to sort the attributes in numerical or alphabetical order. You may also detach the data panel by clicking the icon in the upper right hand corner.
5. Searching
You can search by Node/Edge Attributes using the Select tab at the top of the Control Panel. Click the "plus sign" button and select "Column Filter". From the "Choose column..." dropdown menu, select the node or edge attribute by which you wish to filter (in the below example, Node: organism). At the bottom of the Control Panel, be sure to select "Apply Automatically" in order to watch your selection criteria filter the nodes and thus Table Panel information in real time. Type into the empty field your search criteria (example, Streptomyces) and the network will filter accordingly.
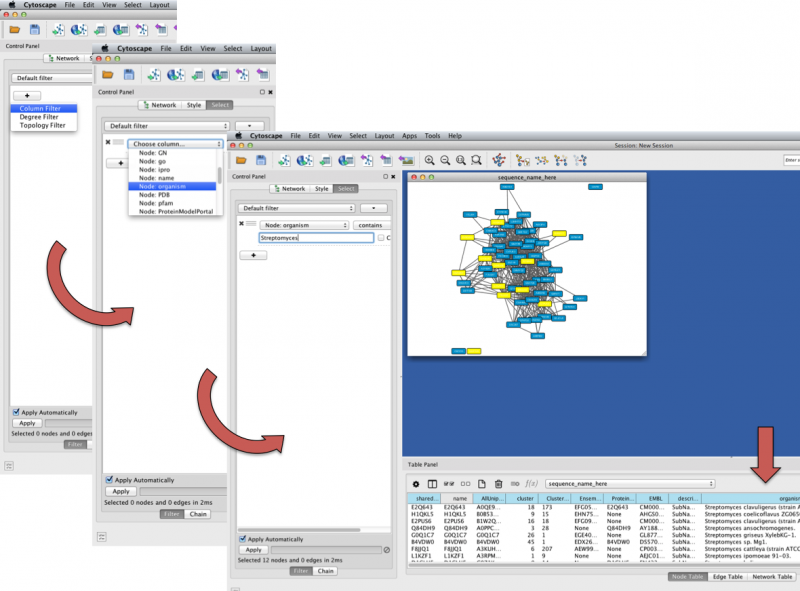
Figure 5. Cytoscape Network Searching Example
A node that matches the search will be highlighted (default, yellow) in the network and also appear in the Table Panel.
6. Changing Visual Styles
There are many options for changing the network visually. Begin by selecting the Style tab of the Control Panel. By default the Style tab displays, and allows you to change basic visual properties such as node shape, line thickness, and backgroud color. While you can adjust the visual properties of any feature, below is the basic process of changing node Fill Color.
- Within the Style tab properties list, click the arrow icon next to Fill Color to display a dropdown menu of options.
- The Fill Color dropdown menu now shows two options; select the Table Panel Column that you want to color by from the Column dropdown menu (e.g. organism).
- Below the Column option is Mapping Type; click the adjacent dropdown menu to select between Discrete Mapping and Passthrough Mapping. Discrete Mapping will allow you to select a different color for each node. Set Mapping Type to Discrete Mapping.
- A list of variables from the selected Table Panel Column will appear. Double-click the space next to each variable and then click the small icon with the ellipsis that appears. Select the color you prefer for that variable. For example, all nodes containing Streptomyces are colored lime green in the example network below.
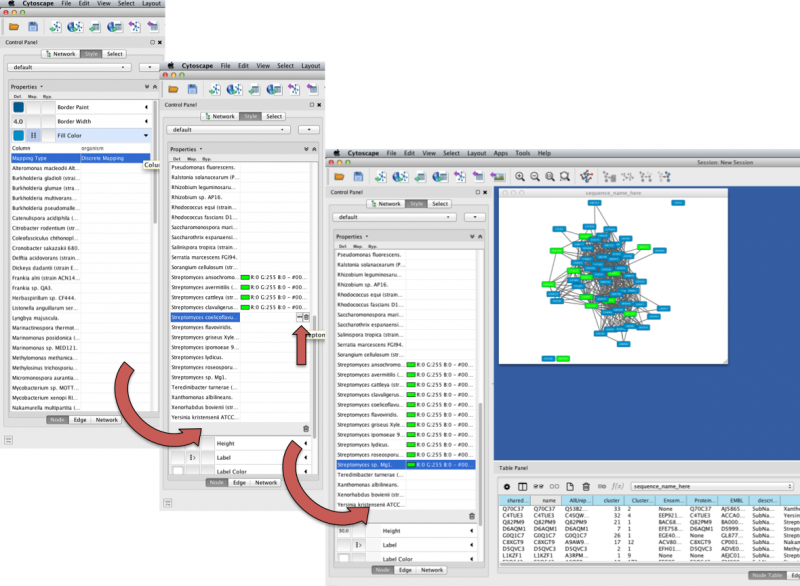
Figure 6. Cytoscape Node Coloring Example
7. Filtering a Network
There may be times when you want to view a network at an e-value more stringent than the one you used to generate the network. This can be done within Cytoscape instead of having to re-compute the network altogether.
- Open the network in Cytoscape and make a copy of the network: File → New → Network → Clone Current Network
- Open the Select tab of the Control Panel
- Delete previous filters by clicking the "X" to the left of the filter criteria
- Add a new filter by clicking the "plus sign" button, then select Column Filter
- Configure filter by selecting "Edge: -log10(E)" from the dropdown menu
- Set the upper and lower limits of the filter by moving the left and right arrows along the scroll bar - note: you cannot get any less stringent than the e-value at which the network was originally calculated (ie. leave the lower limit), but you can achieve greater stringency by increasing the upper limit
- If the Apply Automatically option is selected, the edges that do not satisfy the e-value stringency will turn red
- Delete red edges: Edit → Delete Selected Nodes and Edges
- Re-do the layout: Layout → yFiles → Organic
ALTERNATIVELY - if you deselect the "Apply Automatically" option, you can input the "-log10(E)" lower and upper limits manually with finer resolution and greater accuracy than using the scroll bar.
8. Saving Sessions
Cytoscape can save all workspace states, including networks, attributes, visual styles, properties, and window sizes, into a session file (.cys). To save as a session, click the Save Session "floppy disk" icon on the toolbar and a .cys file will be saved.
9. Opening a Session File
To open the session file, click the Open Session "file folder" icon on the toolbar. A warning pop-up window will be shown. Click OK and select a session file. By doing this, everything will be restored automatically from the file.
Click here to contact us for help, reporting issues, or suggestions.
University of Illinois at Urbana-Champaign
1206 W. Gregory Drive Urbana, IL 61801
efi@enzymefunction.org